Elliott Waves Trades
By Pavlos D
name="twitter:card" content="summary"/meta
Master the art of trading and achieve consistent profitability in any market condition.
Start making winning trades today with expert guidance and real-time insights.
🔹 No commitments – All memberships renew automatically, and you can cancel anytime.
SIMPLE ELLIOTT WAVE THEORY
Let’s have a look at the basic Elliot Wave sequence.
Above shows the Basic Five Wave Idealized Pattern for a Bullish series.
We only try to trade three of these “waves.” That helps keep it simple.
Here are how we “trade the waves.”
Let’s just concentrate on recognizing the waves.
Wave 3 is the easiest wave to spot. It is simple! It is the biggest, most dramatic price movement on the chart. It corresponds with the “Dominant Trend”. We can only confirm Wave 1 and 2 AFTER we see a wave 3. That may sound counter intuitive, but it is true. If you are confused by that – don’t worry – we will clear it up in a bit.
By the time we see a clear wave 3 on a chart, it is usually too late to trade it. Once we see it, we are looking at a wave 4 or wave 5 trade.
WAVE COUNTS
Above $OKE chart indicates wave 3.
Wave 3 is the biggest, most dramatic price movement on the chart. Don’t make it any more complicated than that.
If you see a chart similar to this, it is too late to try and trade wave 3. The uptrend is mature and we cannot tell how much further it will go up, if at all. That’s OK, we can predict with high probability what it is going to do next and that might be tradeable.
You don’t need any indicators to spot a wave 3, but they can help in some cases and they can help with the rest of the wave counts. Let’s look at this wave 3 example with some indicators.
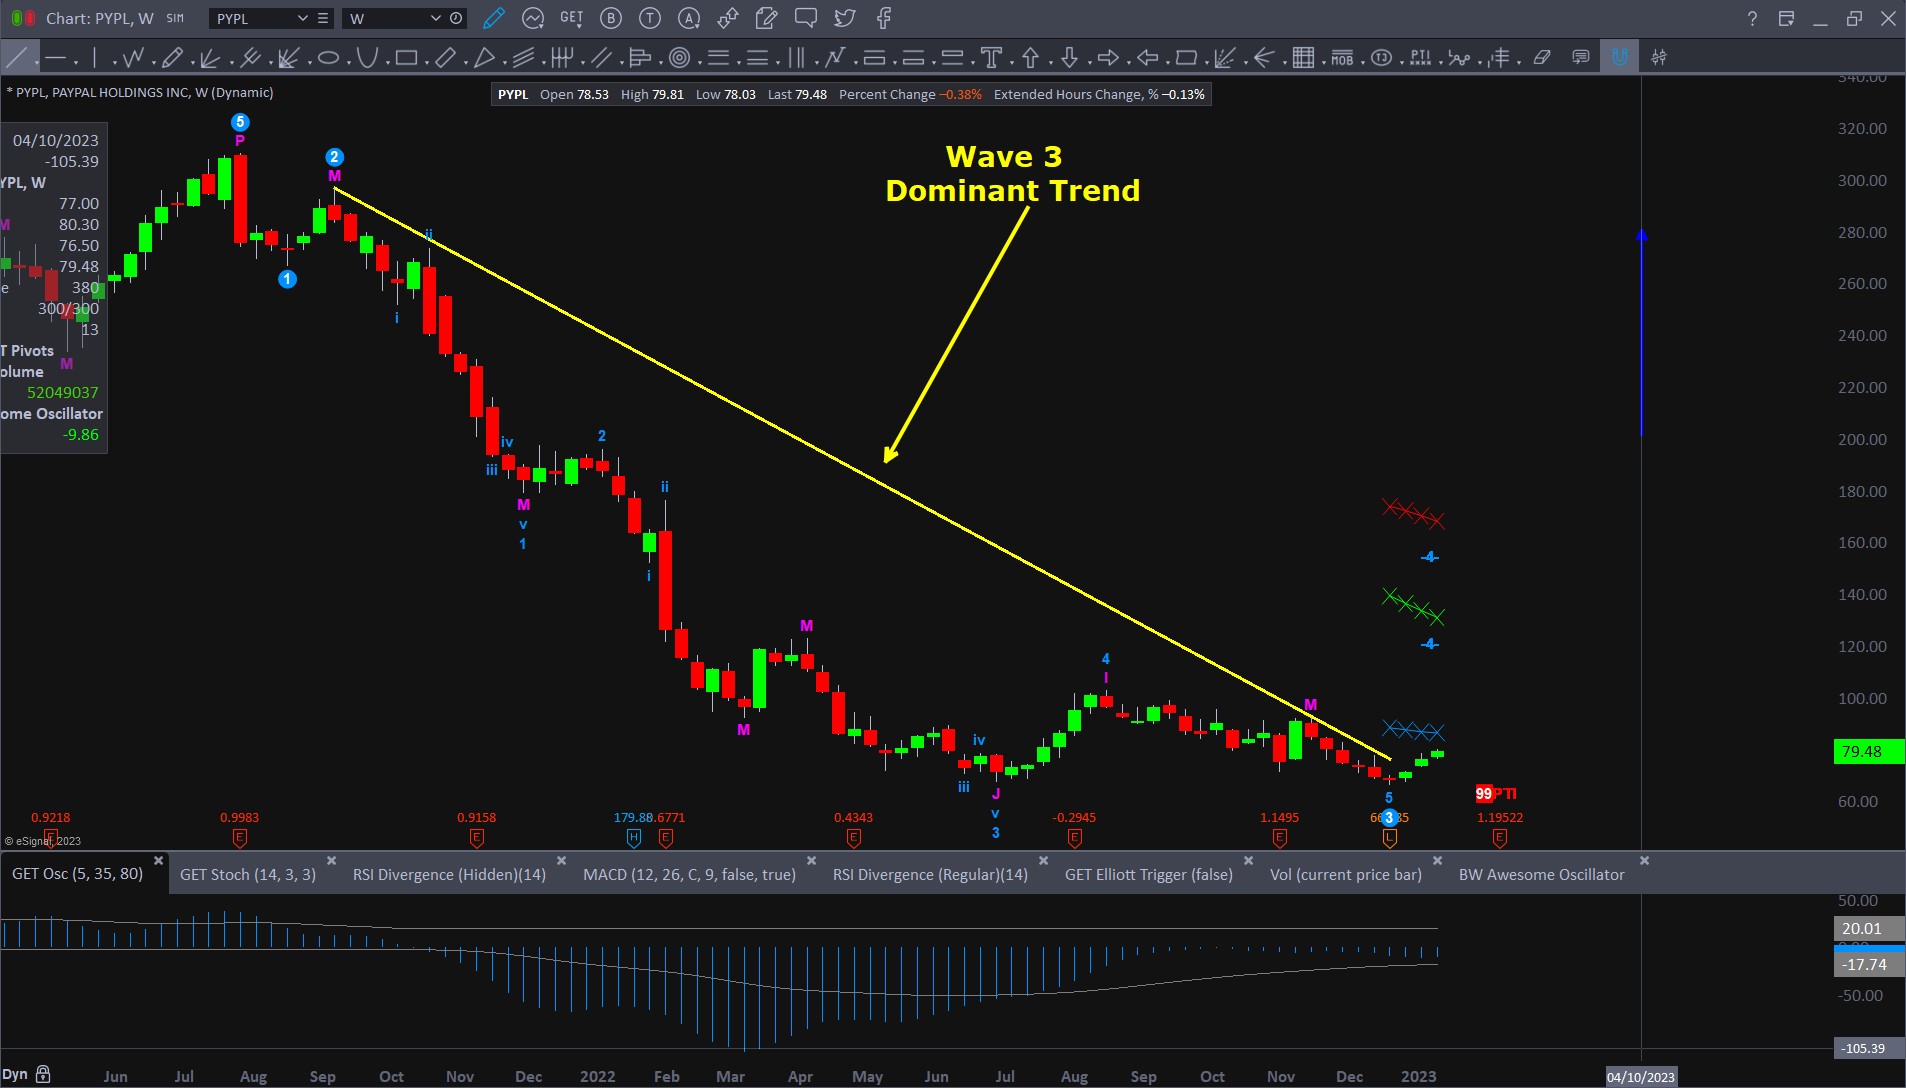
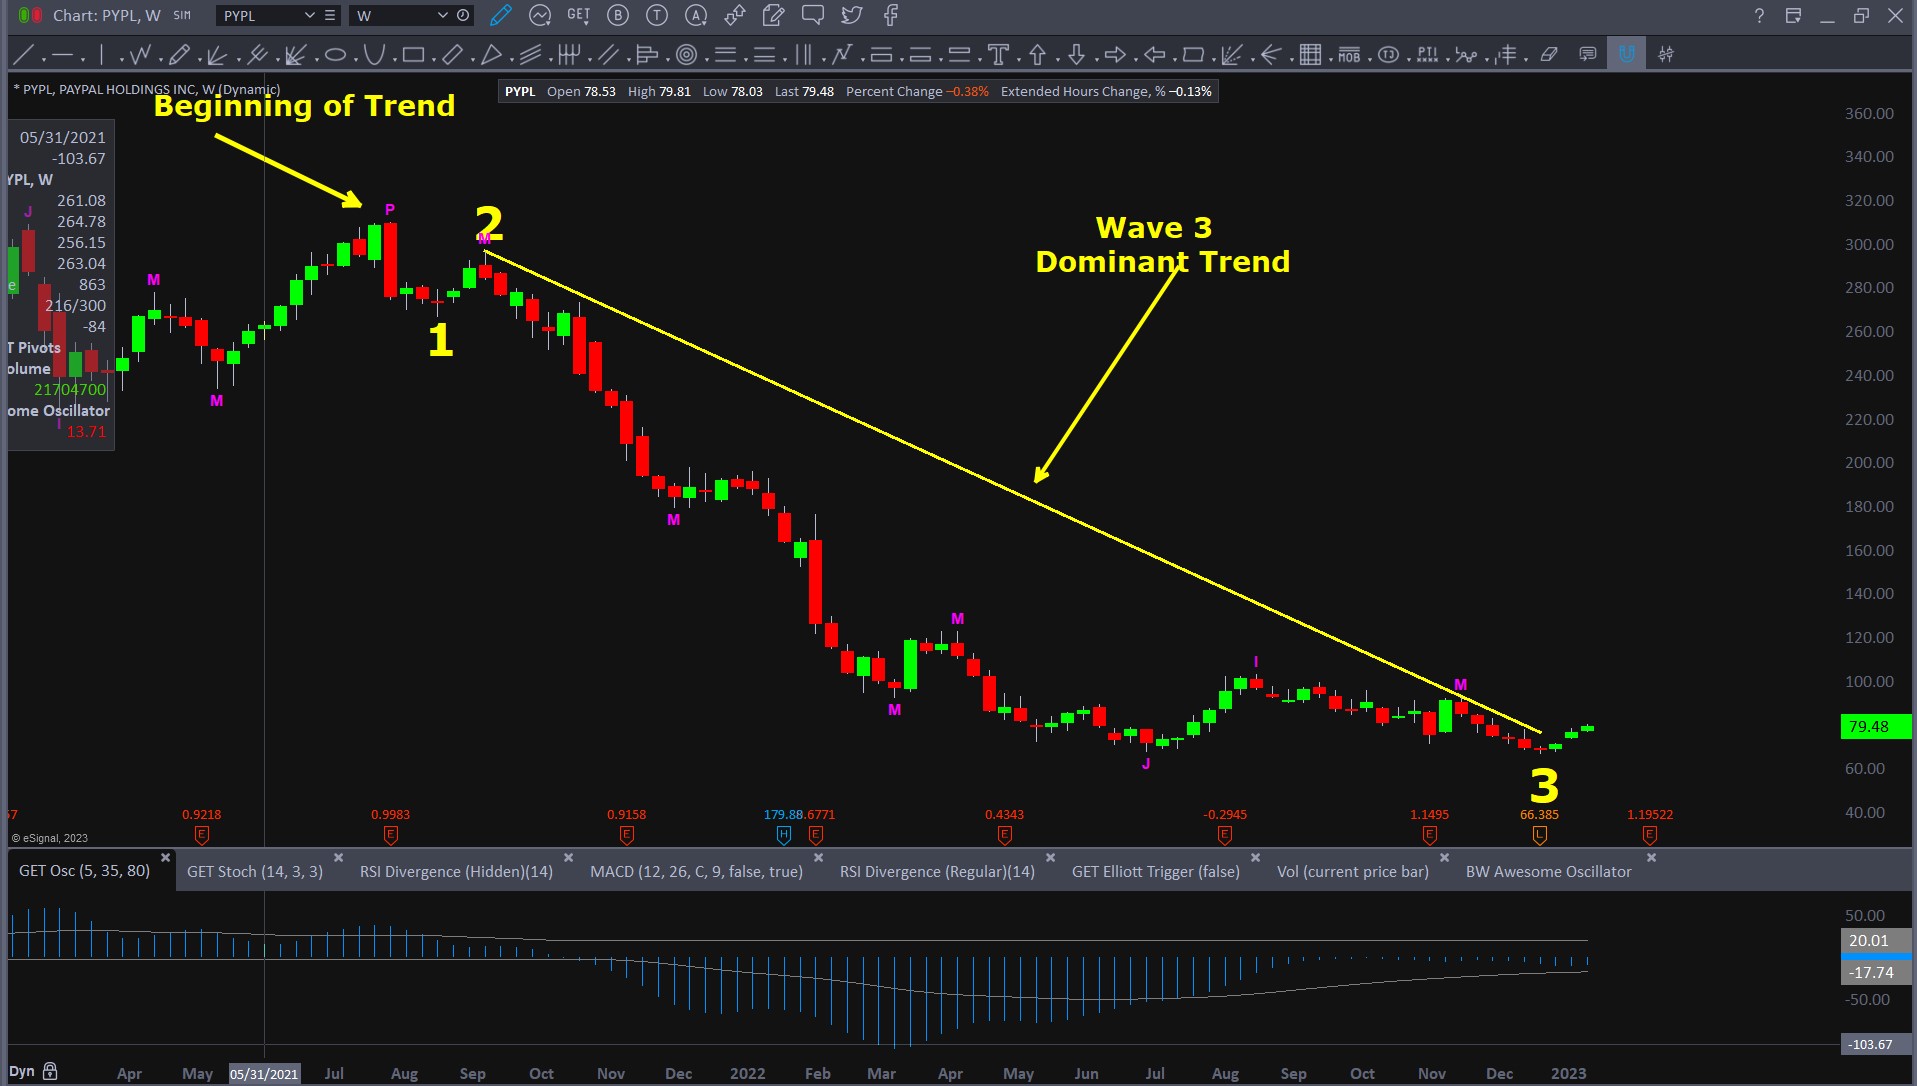
Above chart is $PPYPL, on a weekly chart. This chart is with the Price Oscillator Notice that the largest magnitude oscillator bars occur during wave 3, not necessarily at the beginning, end or in any specific location. It is OK that the oscillator even goes positive at some points during wave 3.
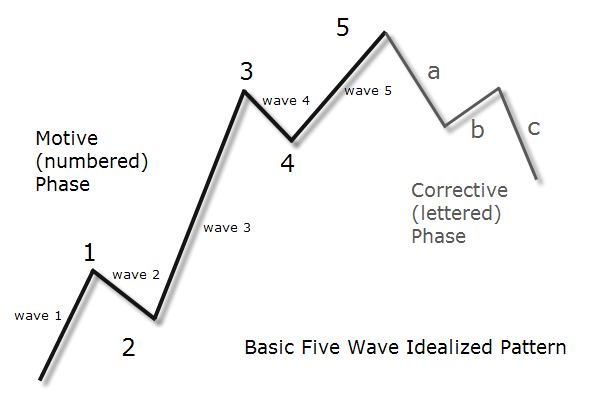
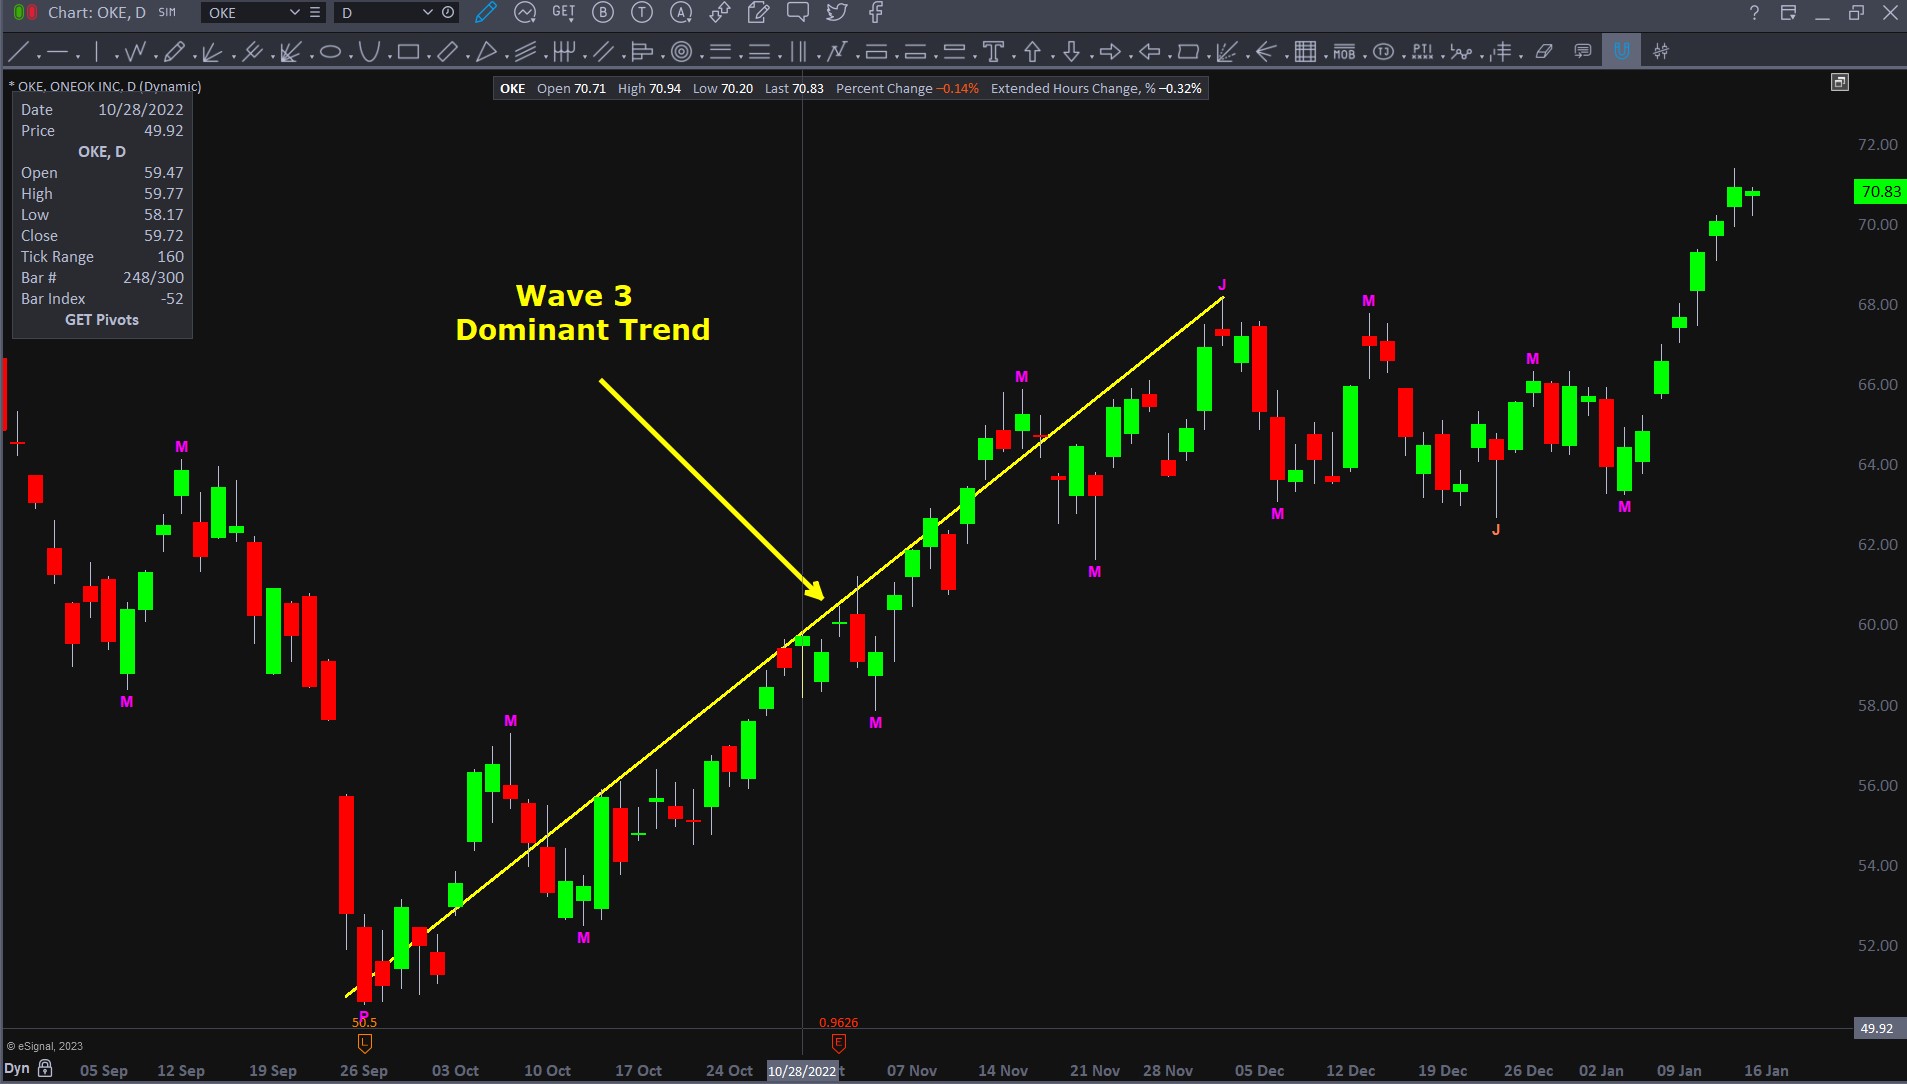
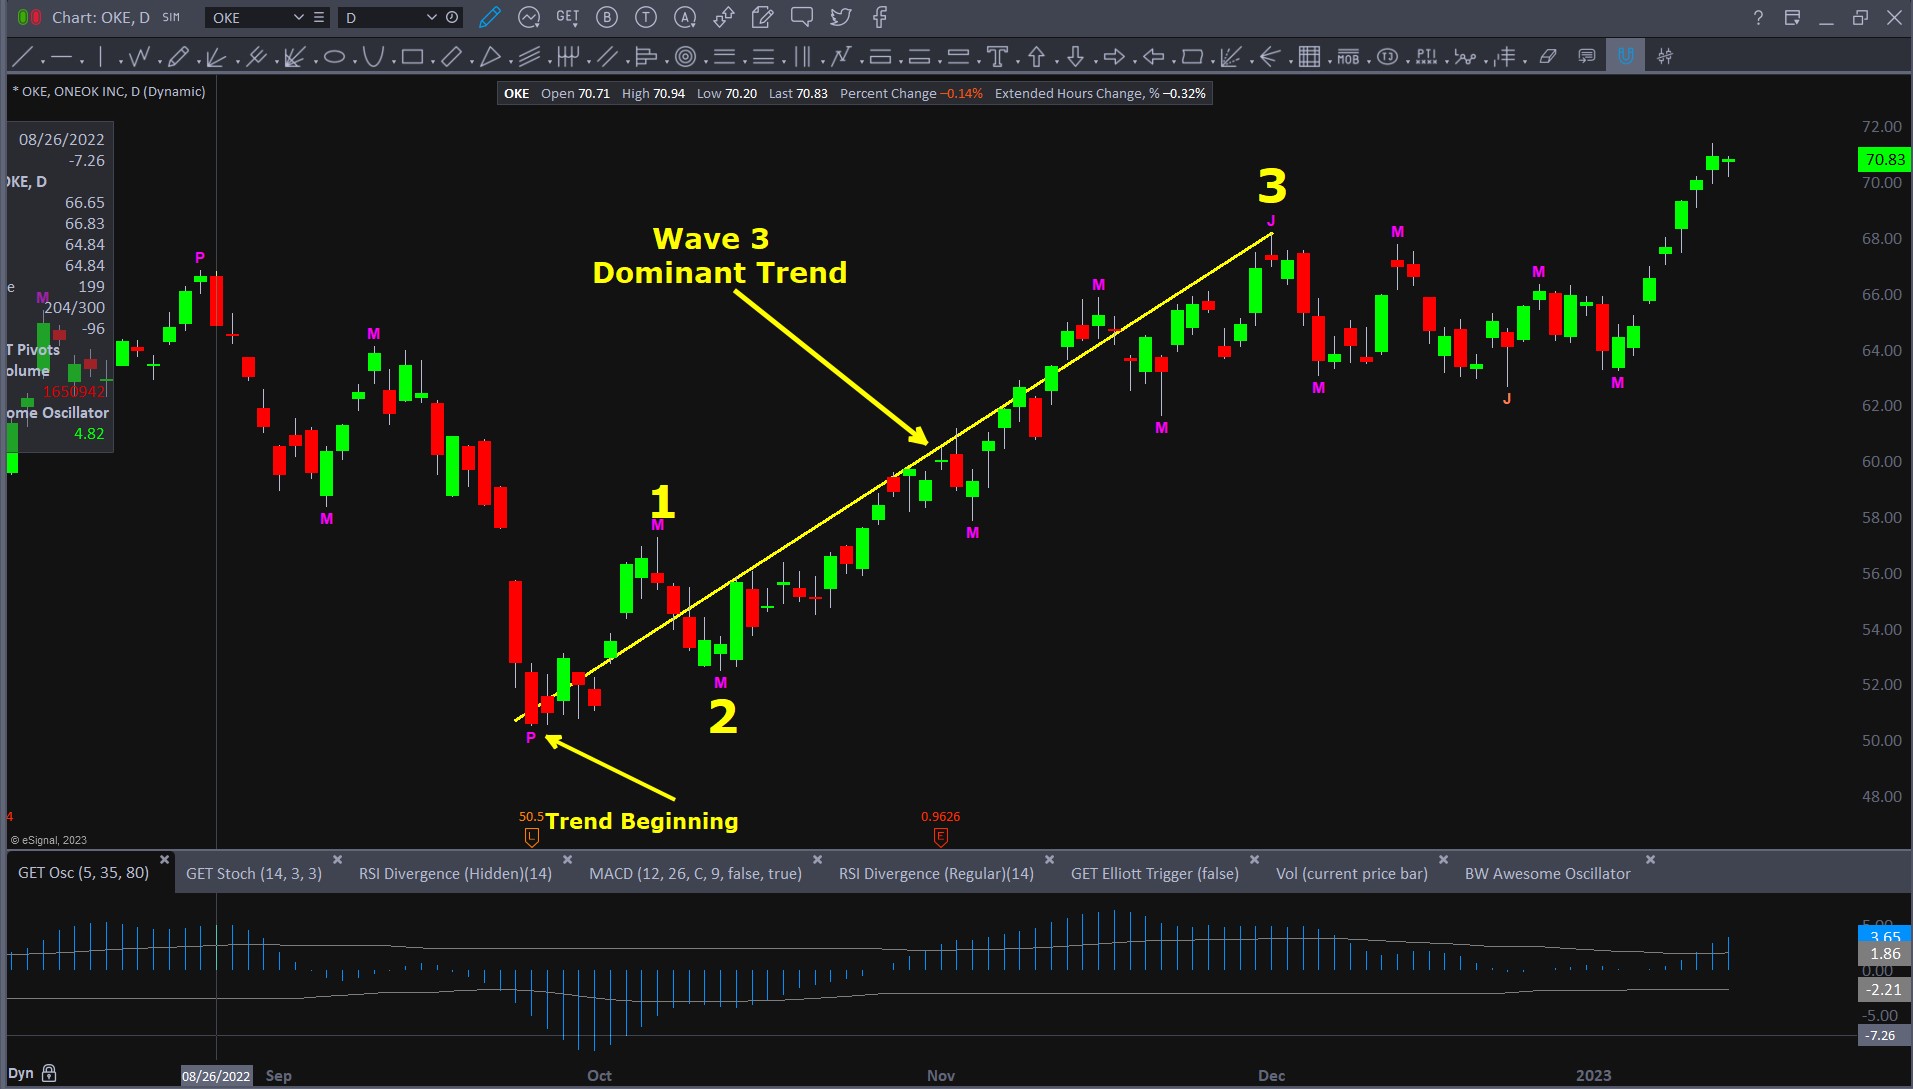
Same as with $OKE example, it is easy to spot wave 3 even without indicators. It is simply the largest, most dramatic, uninterrupted price movement on the chart.
Notice in both the $PYPL and $OKE examples, wave 3 is an uninterrupted series of Higher Highs – Higher Lows for the Bullish uptrend and Lower Lows – Lower Highs for the Bearish downtrend.
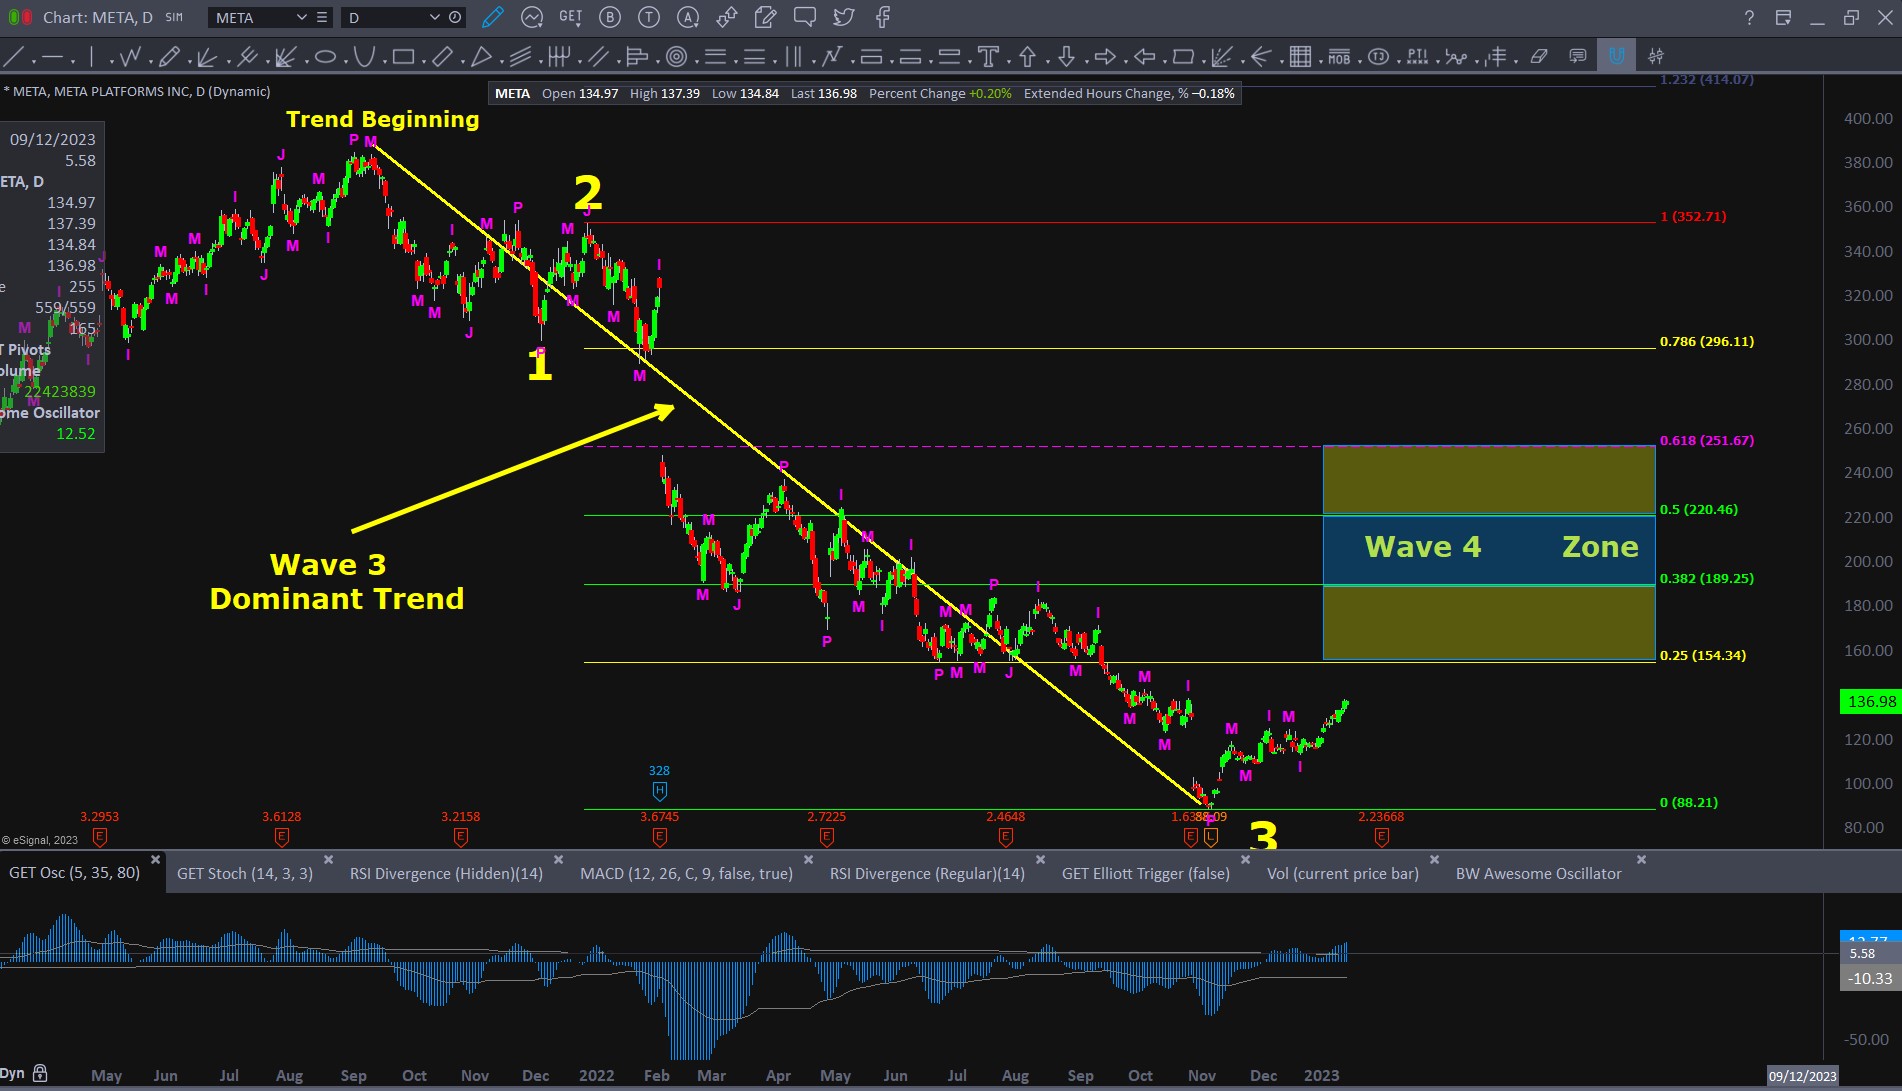
After you identify wave 3, then you can identify waves 1 and 2. Correctly identifying waves 1 and 2 are critical to the next step, which is using Fibonacci tools to project the corrective wave 4 (the Corrective Trend) that is coming, and after wave 4, to projecting where wave 5 (the Continuation Trend) is likely to extend to.
Let’s now identifying waves 1 and 2.
Above image shows again $OKE that we looked at earlier. Notice that the waves are now labeled.
Remember, in order to analyze a trend, you HAVE to have enough data on your chart to see the beginning of the trend. For an uptrend, it is the absolute lowest price bar before the uptrend started. For a downtrend it is the absolute highest price bar before the downtrend started.
Here are the rules for wave 1 and 2
Notice the wave labeling convention that we are using. We are labeling the waves at their endpoints and putting the labels above waves that go up and below waves that go down. We think this is the clearest method and makes the next step, Fibonacci analysis much easier.
Above is $PYPL weekly chart, a Bearish example, with the waves correctly labeled.
Correctly identifying and labeling wave 1 and 2 is an area that most traders seem to have the most trouble with. Most people want to see bigger moves, more like the idealized Elliot Wave picture, to identify the waves. Sometimes they are like that, more often they are just like the ones we have labeled here. Read the rules again and then look at several charts to practice identifying waves 3, then 1 and 2.
Remember, wave 3 is the biggest move. Wave 1 is the first move after the beginning of the trend, in the direction of the trend. Wave 2 is the first move after wave 1 in the opposite direction of the trend. Wave 2 cannot go beyond the beginning of wave 1.
Why is identifying wave 1 and 2 so critical? We need them for our Fibonacci analysis for wave 4 and wave 5, our prediction of what is going to happen next. Our profitability depends on this analysis.
In above chart , we have applied Fibonacci retracement lines to show the probability wave 4 retracement zone.
We can only do this analysis once we have confirmed that wave 3 has ended and that wave 4 has started. In this example, wave 4 has started. Look at the Higher Low – Lower High – New Low pattern.
The high probability and ideal Fibonacci retracement for wave 4 is 38.2 – 61.8% of the distance from wave 2 to wave 3.
Notice that the Fibonacci retracement lines are drawn from the bottom of wave 2 to the top of wave 3 in this Bullish Trend example.
Can you see now why having the waves correctly identified and labeled is so important?
70% of all wave 4’s retrace to the 38.2 – 61.8% Fibonacci levels. 30% fall short of the 38.2% level and another 30% exceed the 61.8% level. It is OK if the retracement misses by a little bit. The more the retracement goes outside the ideal levels, the more likely that that subsequent waves will not follow the expected pattern. A retracement of more than 76.4% disqualifies wave 4 and something else is going on – best to move on to a different chart.
$META on a daily chart. This is a great example of a Bearish Trend that has completed waves 1, 2, 3 and has a potential wave 4 in progress. At this point we have no way of knowing if wave 4 will continue up some more, or begin the next move down into wave 5. We have to wait for confirmation of a trend change using some rules.
Wave 4 rules:
It is OK if the retracement misses by a little bit. The more the retracement goes outside the ideal levels, the more likely that that subsequent waves will not follow the expected pattern. A retracement of more than 76.4% disqualifies wave 4.
After wave 4, of course, is wave 5. As stated earlier, wave 5 has the highest probability of reaching our projected targets. This is because we have had four waves prior to wave 5 that met the rules, and price movement is falling into a very predictable and high probability pattern.
Above image is a daily stock chart for $FSLR The waves are correctly labeled and you can see that wave 3 completed and then the trend was confirmed to change to corrective. Wave 4 met all the rules almost perfectly.
Wave 5 confirmed and used the Fibonacci extension tool to project the wave 5 target zone.
The Fibonacci extension tool needs three data points to draw the extension lines. On a Bullish trend we draw from the bottom of wave 2, to the top of wave 3 and the bottom of wave 4.
The wave 5 target zone is between the Fibonacci extension levels of 61.8 – 100%.
Wave 5 rules:
Most charts that you look at will not have a clear wave pattern. Don’t be confused or frustrated by that. Do not try to see wave patterns where they do not exist. Focus on trying to spot good patterns and spending time analyzing them.
Waves 3 and 5 are Impulsive Waves. These are the preferred waves to trade. There are some reasons for this;
Wave 4 is a Corrective Wave. These are not the preferred waves to trade. Here are some reasons why;
An ABC pattern on wave 4 is actually good. We like to see it because it adds further evidence that a classic Elliott Wave sequence is playing out and it makes wave 5 even more probable. There are never guarantees, of course, but the higher probability that we have, the better.
Quite often, we see in an ABC corrective trend that the price movement of C leg is about 1.5 times that of the A leg. Again, this is not required but does fit into a classic Elliott Wave sequence and adds probability to the overall sequence.
On above image $CME, notice that all of the rules are met for wave 3, then 1 and 2 and for wave 4. The ABC pattern for wave 4 is labeled.
As a review, walk through all of the wave rules and see if you can recognize and confirm them.
Sometimes, we do take Corrective Wave trades. Here are some reasons that would lead us to take them;
If you are concerned about taking Corrective Wave trades, it is a legitimate strategy to just pass on them. You may have to sit out the market for a while. Depending on the timeframe you trade, that could be hours, days, weeks or months. The key thing is to be patient and not take trades that make you uncomfortable.
Categories
Tags