Elliott Waves Trades
By Pavlos D
Master the art of trading and achieve consistent profitability in any market condition.
Start making winning trades today with expert guidance and real-time insights.
🔹 No commitments – All memberships renew automatically, and you can cancel anytime.
TRADE SETUPS
We only have three basic trade setups. That may come as a surprise, but that is really all we need and has proven to absolutely sufficient for profitable trading.
Here are the three trade setups that we look for and use in our trading;
Note: A Channel Breakout can occur on any of the trade setups that we will discuss. They are more common on Wave 4 Corrections and New Trends, but a market can channel before Wave 5 begins as well.
Here are the details on each setup:
1) Wave 5 Trend Continuation
This is the easiest trade setup to spot and has the highest probability of winning. It is high probability because we have had 4 waves prior that had to have met the rules and the probability of the 5th wave completing the sequence is very high.
The other nice thing about Wave 5 Trend continuation trades is that we can predict, with pretty high certainty, a price target using Fibonacci Extension lines. Having a high certainty price target is REALLY helpful in calculating the Reward/Risk ratio for the trade.
We talked in another post about being able to recognize patterns on charts very quickly. A Wave 5 Trend Continuation setup has a very distinctive and recognizable pattern.
See Figure below:
Above figure is a very simple representation of the pattern we are looking for on a Bullish chart.
It has an impulsive Wave 3 and then a corrective Wave 4.
We have to measure the retracement and then look for a Wave 1 and Wave 2, but this basic shape should capture your attention immediately as a pattern that is worth analyzing.
See below figure:
Above figure is an example of a Bearish Trend with an impulsive wave and then a correction that is worth analyzing.
In both above examples,at the end of of wave 4 the trade is not ready yet, but these are the patterns that we can see forming ahead of time and can then put on a “watch list” and wait for the rest of the criteria to be met before taking the trade.
See below figure:
Above figure is $STLD on a daily chart with the impulsive and corrective waves marked. This is the early pattern, the shape, that we are looking for, in advance of a Wave 5 Bullish setup.
See below figure
Above figure is META on a daily chart, with the impulsive and corrective waves marked. This is the early pattern, the shape, that we are looking for, in advance of a Wave 5 Bearish setup.
All of the examples we’ve shown so far for a Wave 5 setup only have Wave 3 and Wave 4 shown. The purpose of these examples is to show what we are looking for, ahead of time, as a potential Wave 5 trade is setting up.
Of course, we have to wait for the Beginning of Wave 5 to be proven, using our Dow Theory tools. We will get into the exact entry setup in the next section, Trade Entry Criteria
2.) Wave 4 Correction
Wave 4 corrective trades are easy to spot, but they can be a little bit difficult. These trades are counter to the major trend and can sometimes move in complex patterns.
If you are uncomfortable or uncertain about corrective wave trades, it is OK to not trade them and to just focus on the other two setups, which are impulsive wave trades.
The reason that we include this setup and that we trade these corrective wave trades is that, depending on what the broad market is doing, these may be the majority of trade setup that we find. At the time of this writing, corrective wave trades are currently the majority of what we see in our scanning.
Also, there may be very large profit potential in corrective wave trades, after a long impulsive move. As with all trade setups, it is critical to calculate the Reward/Risk ratio and make sure that sufficient profit potential exists.
It may make sense to use a higher Reward/Risk ratio threshold for corrective wave trades and only take the ones that truly do have high reward potential.
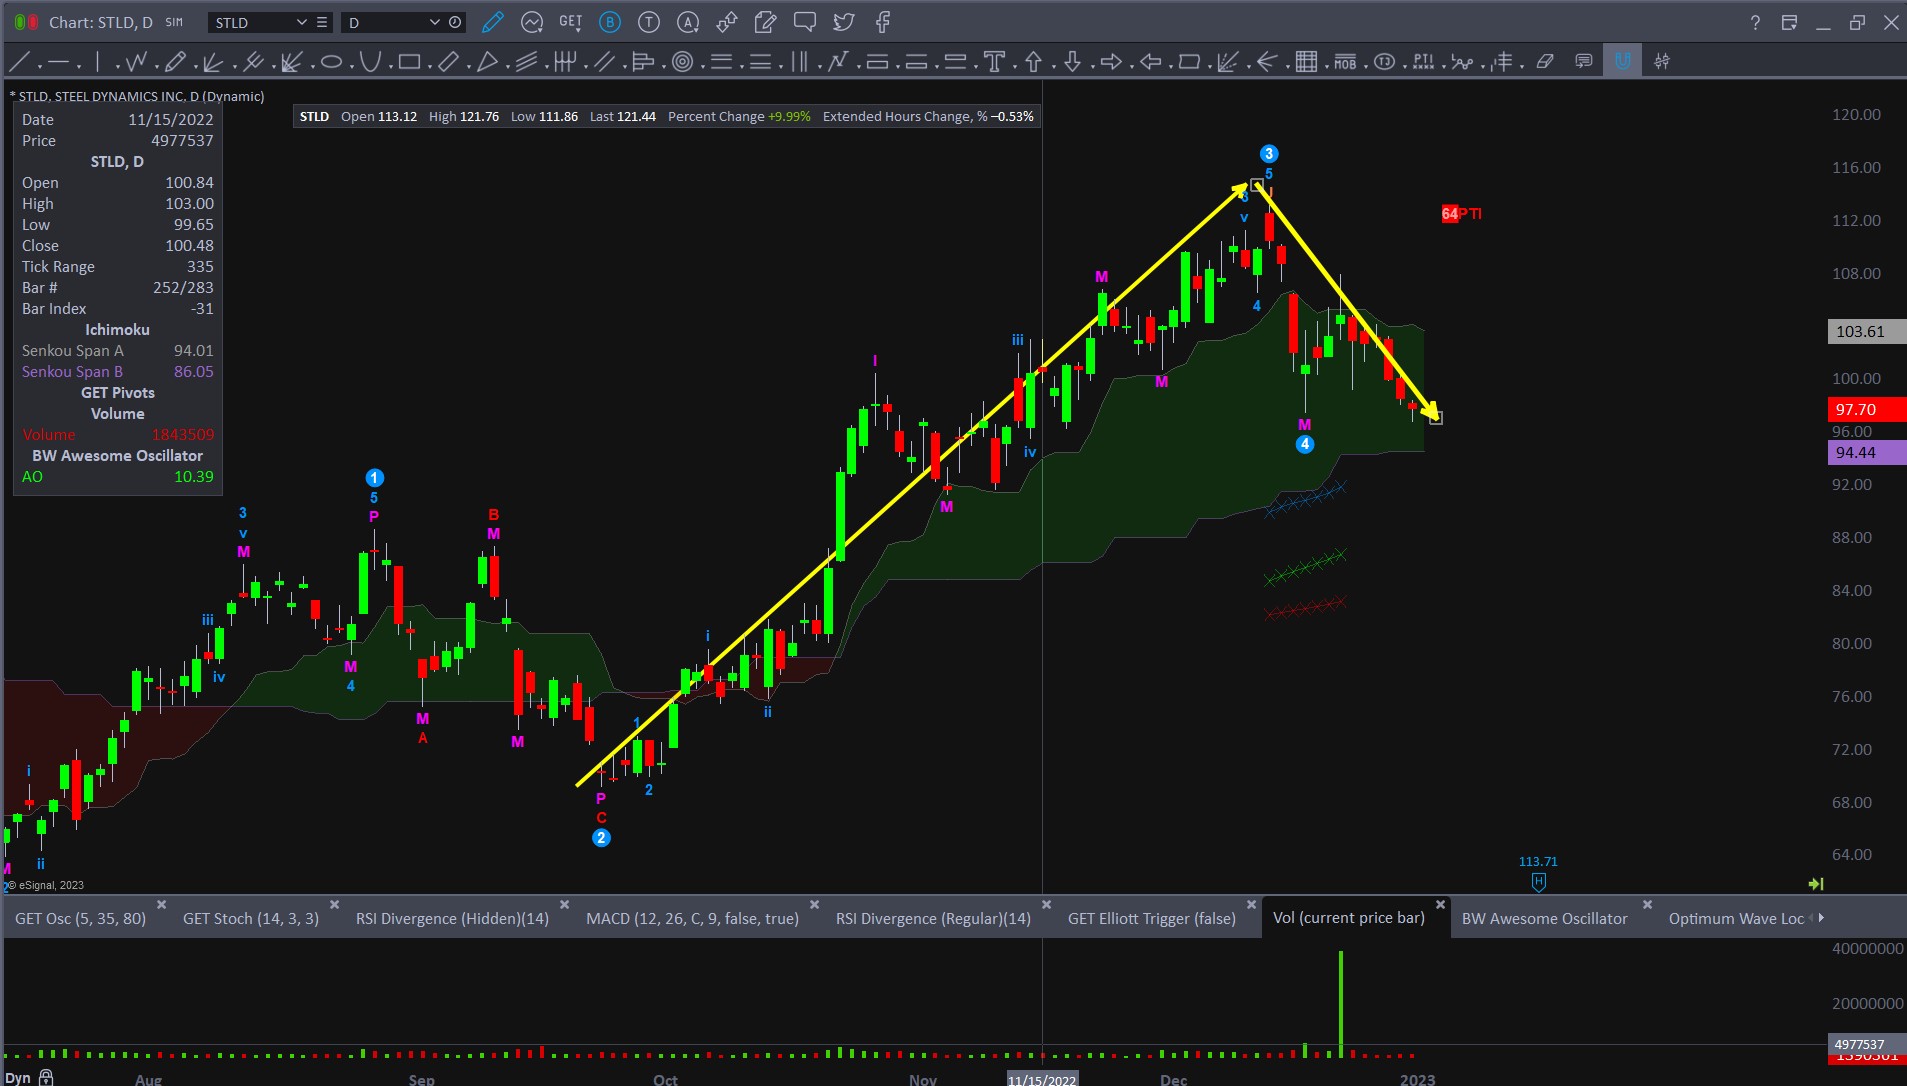
The setup for a Wave 4 Correction is REALLY simple! You just have to see an impulsive wave that has not corrected yet.
See below image
Above figure is $MRNA. The Bullish impulsive wave, that has not yet corrected, is marked. When we see a move like this, we expect that it will correct at some point, and a Wave 4 Correction trade is possible.
See below figure:
Above figure is $RBLX on a daily chart. The Bearish impulsive wave, that has not yet corrected, is marked. When we see a move like this, we expect that it will correct at some point, and a Wave 4 Correction trade is possible.
All of the examples we’ve shown so far for a Wave 4 Correction setup only have Wave 3 shown. The purpose of these examples is to show what we are looking for, ahead of time, as a potential Wave 4 Correction trade is setting up.
Of course, we have to wait for the Beginning of Wave 4 to be proven, using our Dow Theory tools. We will get into the exact entry setup in the next section, Trade Entry Criteria.
3.) New Trend
The final trade setup is a New Trend trade. New Trends can originate from two different patterns;
See below figure:
Above figure is $MRNA on a daily chart. Notice that on this timeframe and chart, there is no existing trend. Price has been in a channel (moving between a well-defined upper and lower price boundary) for an extended number of price bars.
Also, notice on the far right hand side of the chart that price has broken out of the channel. This is where New Trends can emerge from. If you go look at charts that have well established Impulsive Trends or Waves, you’ll notice that sometimes they originated from a channel like the one.
Once price does break out of the channel, we wait for our Dow Theory rules to be met to confirm that a new trend has definitely begun. We will cover the exact entry details in the Trade Entry Criteria section.
See below figure:
Above figure is $QCOM on a weekly chart. Notice that 5 Waves have completed in the downtrend. Waves 1-5 are labeled. Waves 5 just barely met the criteria, but it did meet them.
The New Trend is showing clear proof of starting, using our Dow Theory rules.
Notice also, the “shape” formed by the 5 Wave Bearish sequence. This is a shape that we are looking for. When we see it, we know a few things;
TRADE ENTRY CRITERIA
We will explain now the exact criteria for each of the three setups that we teach (and that we trade with!)
This is not a complete set of trading rules yet.
The full trading rules will be explained in another post after we review Risk/Reward analysis, Trade Management and Exit Criteria.
Wave 5 Trend Continuation
Wave 3 must be present.
Waves 1 and 2 must be clearly identified.
Wave 4 must have been completed. - Retraced to Fibonacci levels of 38.2% - 61.8%
These levels are ideal. 70% of Wave 4’s retrace to these levels
Wave 4 can retrace less than 38.2%, but it lowers the overall probability of the wave count and the trade.
Wave 4 can retrace beyond 61.8%, but it lowers the overall probability of the wave count and the probability of the trade.
Wave 4 CANNOT retrace more than 76.4%. This invalidates the wave count.
The Price Oscillator changes direction from Wave 3
E.g. Bullish trend has positive oscillator, Wave 4 must go negative.
Bearish trend has negative oscillator, Wave 4 must go positive.
Wave 5 must “prove” that it has begun using Dow Theory rules.
E.g. Bullish Wave 5 has Higher-High, Higher-Low, New High AFTER Wave 4 completed.
Bearish Wave 5 has Lower-Low, Lower High, New Low AFTER Wave 4 completed.
Oscillator must change direction back to the same as Wave 3.
The entry price for Wave 5 trade is one tick above the New High for Bullish trades and one tick below the New Low for Bearish trades
Entries are possible later that the “one tick” above or below the price that confirms Wave 5. In the Reward/Risk section we will demonstrate how to calculate a price entry range.
We will demonstrate this trade setup in the video and in the live webinar sessions.
Wave 4 Correction
Oscillator must change direction from Wave 3.
New Trend
Note: New Trends are often where Wave 3’s originate. Be careful that the Higher-High or Lower-Low sequence that you are analyzing are meaningful price moves, within the context of previous price movement. You don’t want to get into what you think is a New Trend only to find out you entered on Wave 1 and got stopped out.
Categories
Tags