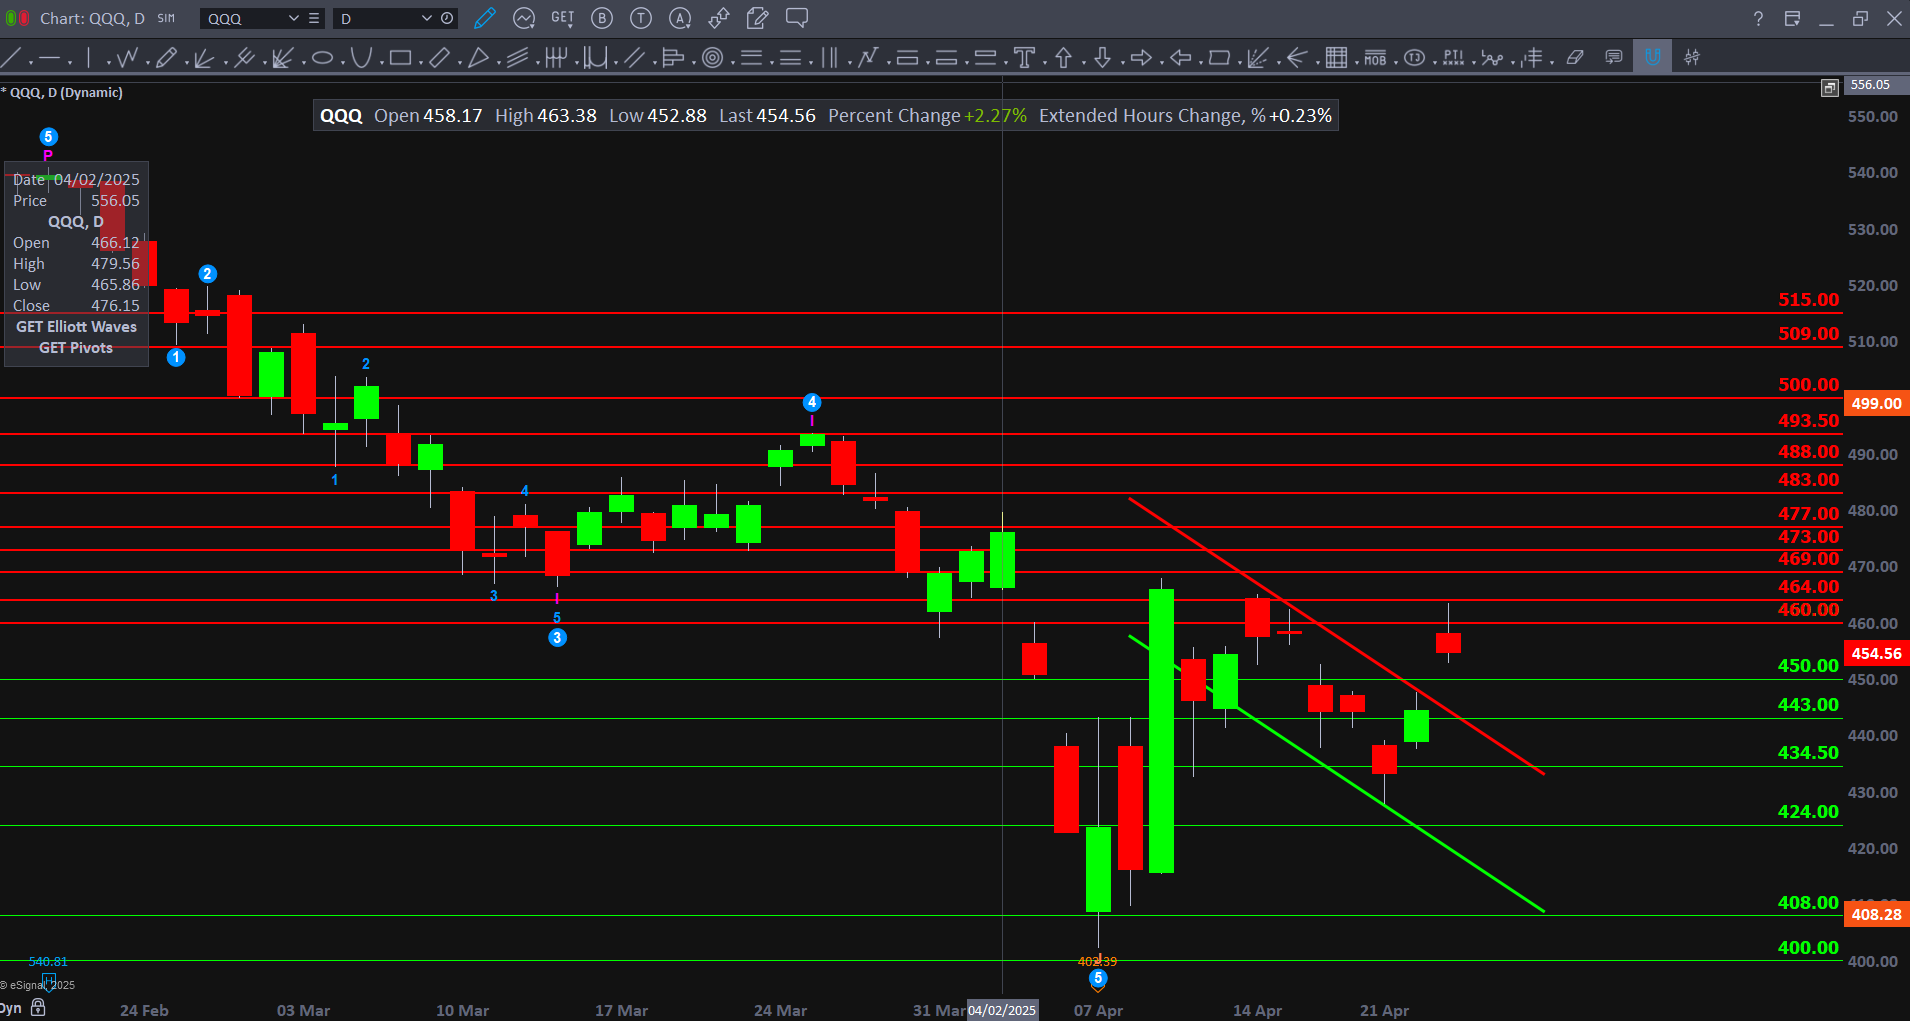
$QQQ closed at $454.56 (+2.27%) today, showing strength after breaking out of a short-term downtrend channel. The move above the key $450 level is encouraging, with back-to-back green candles signaling potential momentum shift.
Key Levels to Watch:
Resistance Zones: $460 → $464 → $469
Support Levels: $450 (reclaimed), $443, $434.50
Major downside pivot at $408 remains critical.
$QQQ Daily Chart
(Click image to enlarge)
$NVDA Technical Snapshot – April 23, 2025
$NVDA – Technical Snapshot
$NVDA closed at $102.71, gaining +3.86% on the day. The stock bounced off recent lows but failed to hold above key resistance at $104, rejecting near the top of a short-term descending channel.
Key Levels to Watch:
Resistance Zones: $104 → $109 → $113 → $115.67
Support Levels: $100 (psychological), $97.50, $93.25
Major downside pivot at $90.50 remains critical.
$NVDA Daily Chart
(Click image to enlarge)
$TSLA Technical Snapshot – April 23, 2025
$TSLA – Technical Snapshot
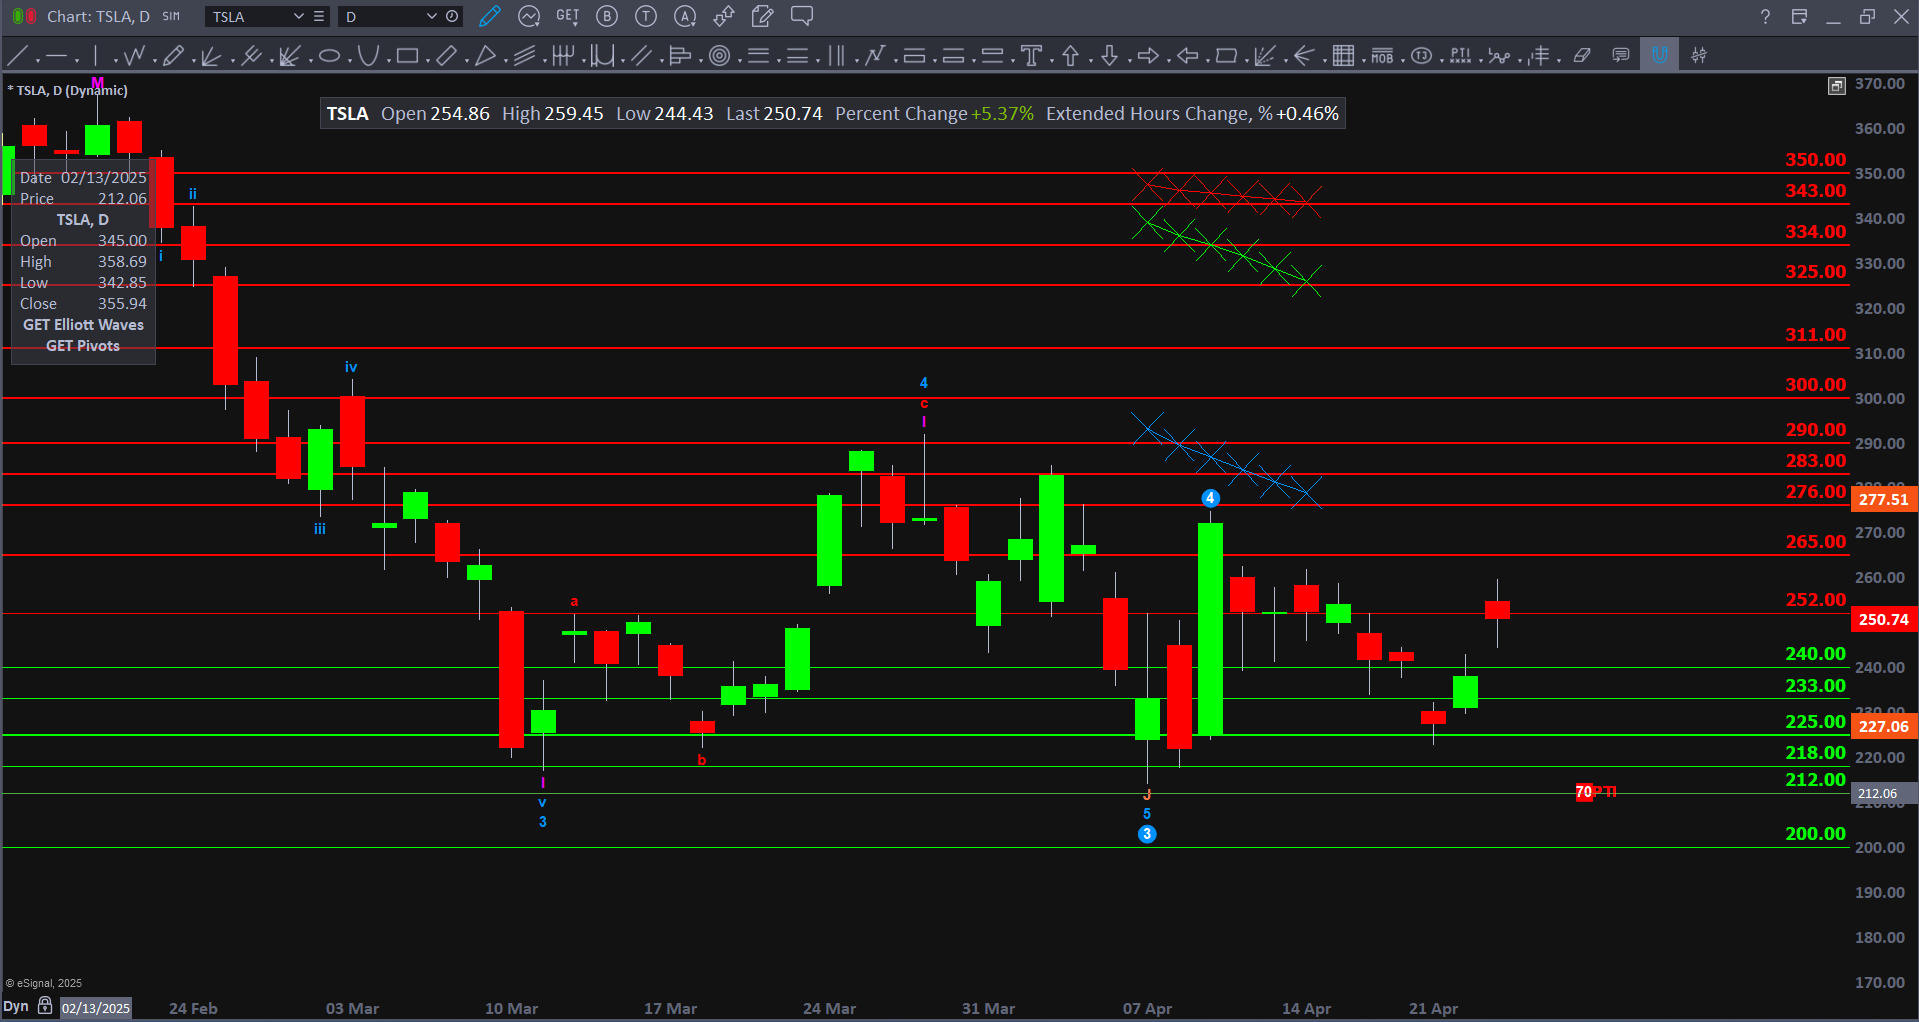
$TSLA closed at $250.74, gaining +5.37%—rebounding sharply off recent lows near $227. The stock pushed toward resistance at $252, but hasn't cleared it yet.
Key Levels to Watch:
Resistance Zones: $252 → $265 → $276 → $283
Support Levels: $240 → $233 → $225
Major downside pivot at $212 remains key for any deeper pullback.
$TSLA Daily Chart
(Click image to enlarge)
$AAPL Technical Snapshot – April 23, 2025
$AAPL – Technical Snapshot
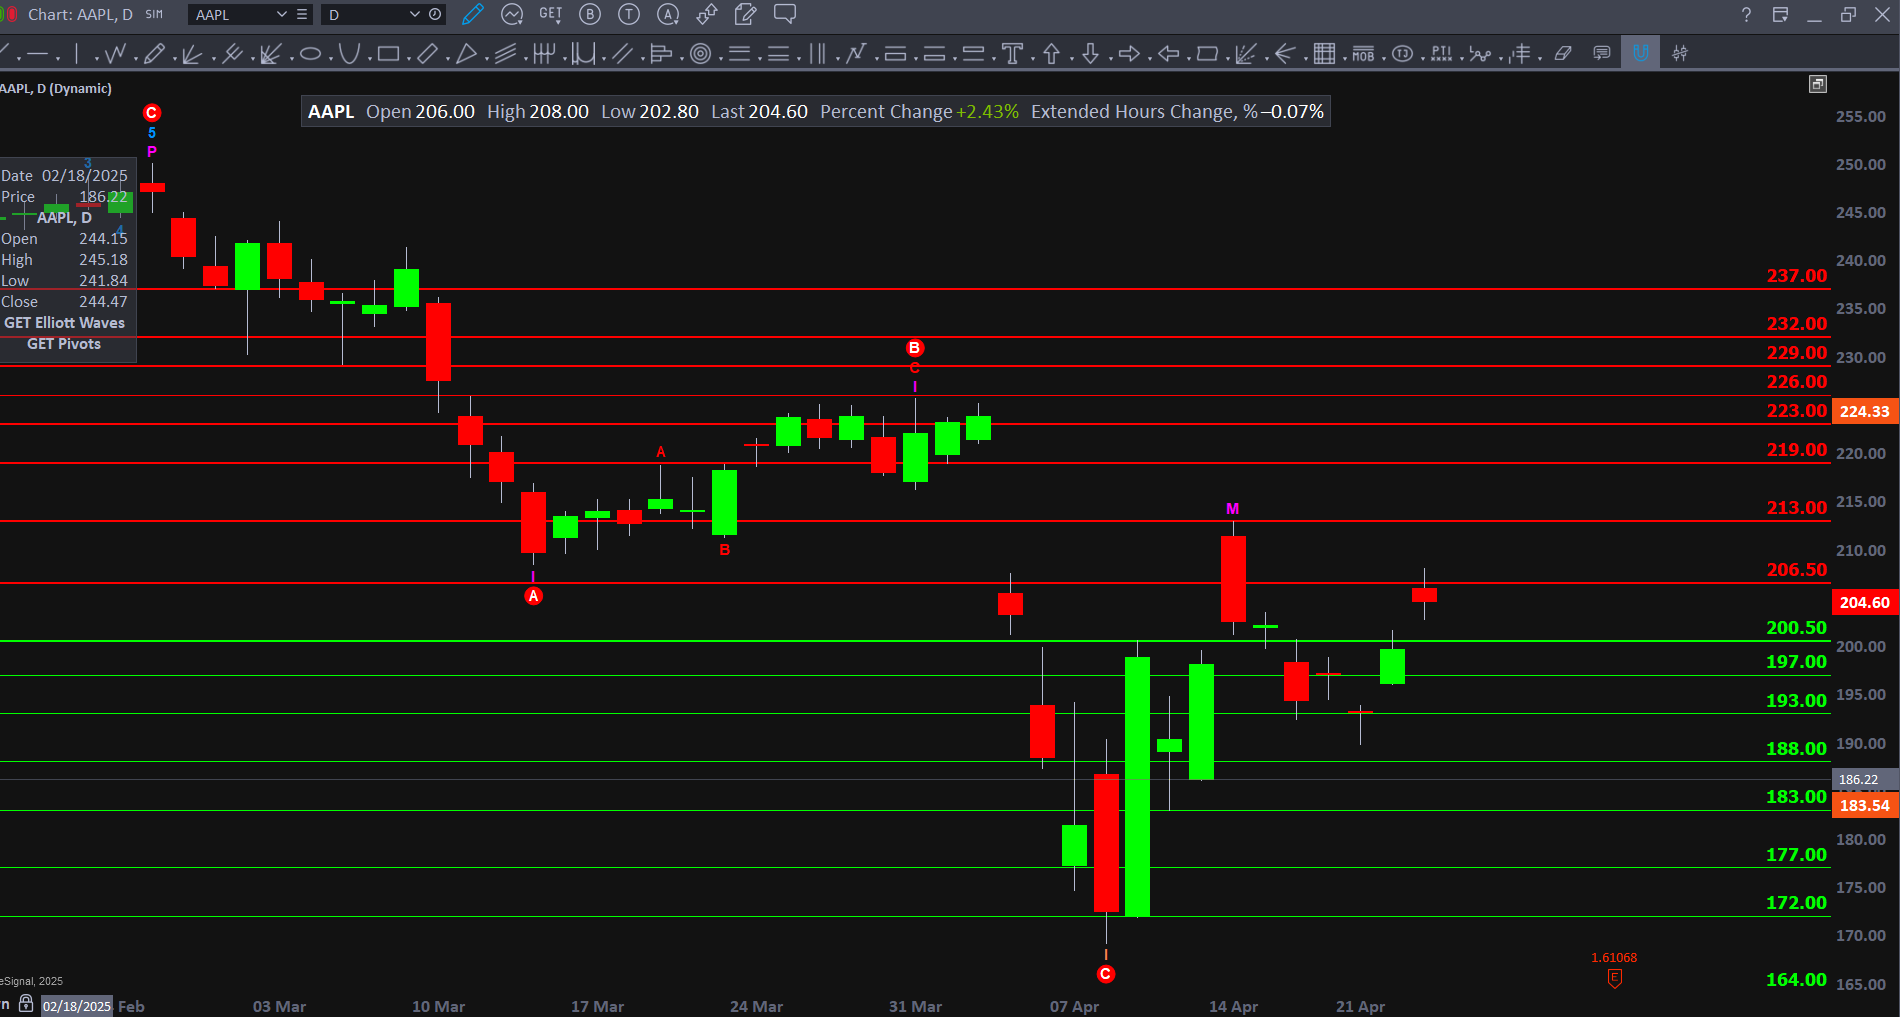
$AAPL closed at $204.60, up +2.43%, continuing its recovery from the sharp selloff earlier this month. The stock is currently testing resistance just below the $206.50 level after reclaiming multiple support zones.
Key Levels to Watch:
Resistance Zones: $206.50 → $213 → $219 → $223
Support Levels: $200.50 → $197 → $193
Major downside pivot at $183.54 remains critical.
$AAPL Daily Chart
(Click image to enlarge)
$AMZN Technical Snapshot – April 23, 2025
$AMZN – Technical Snapshot
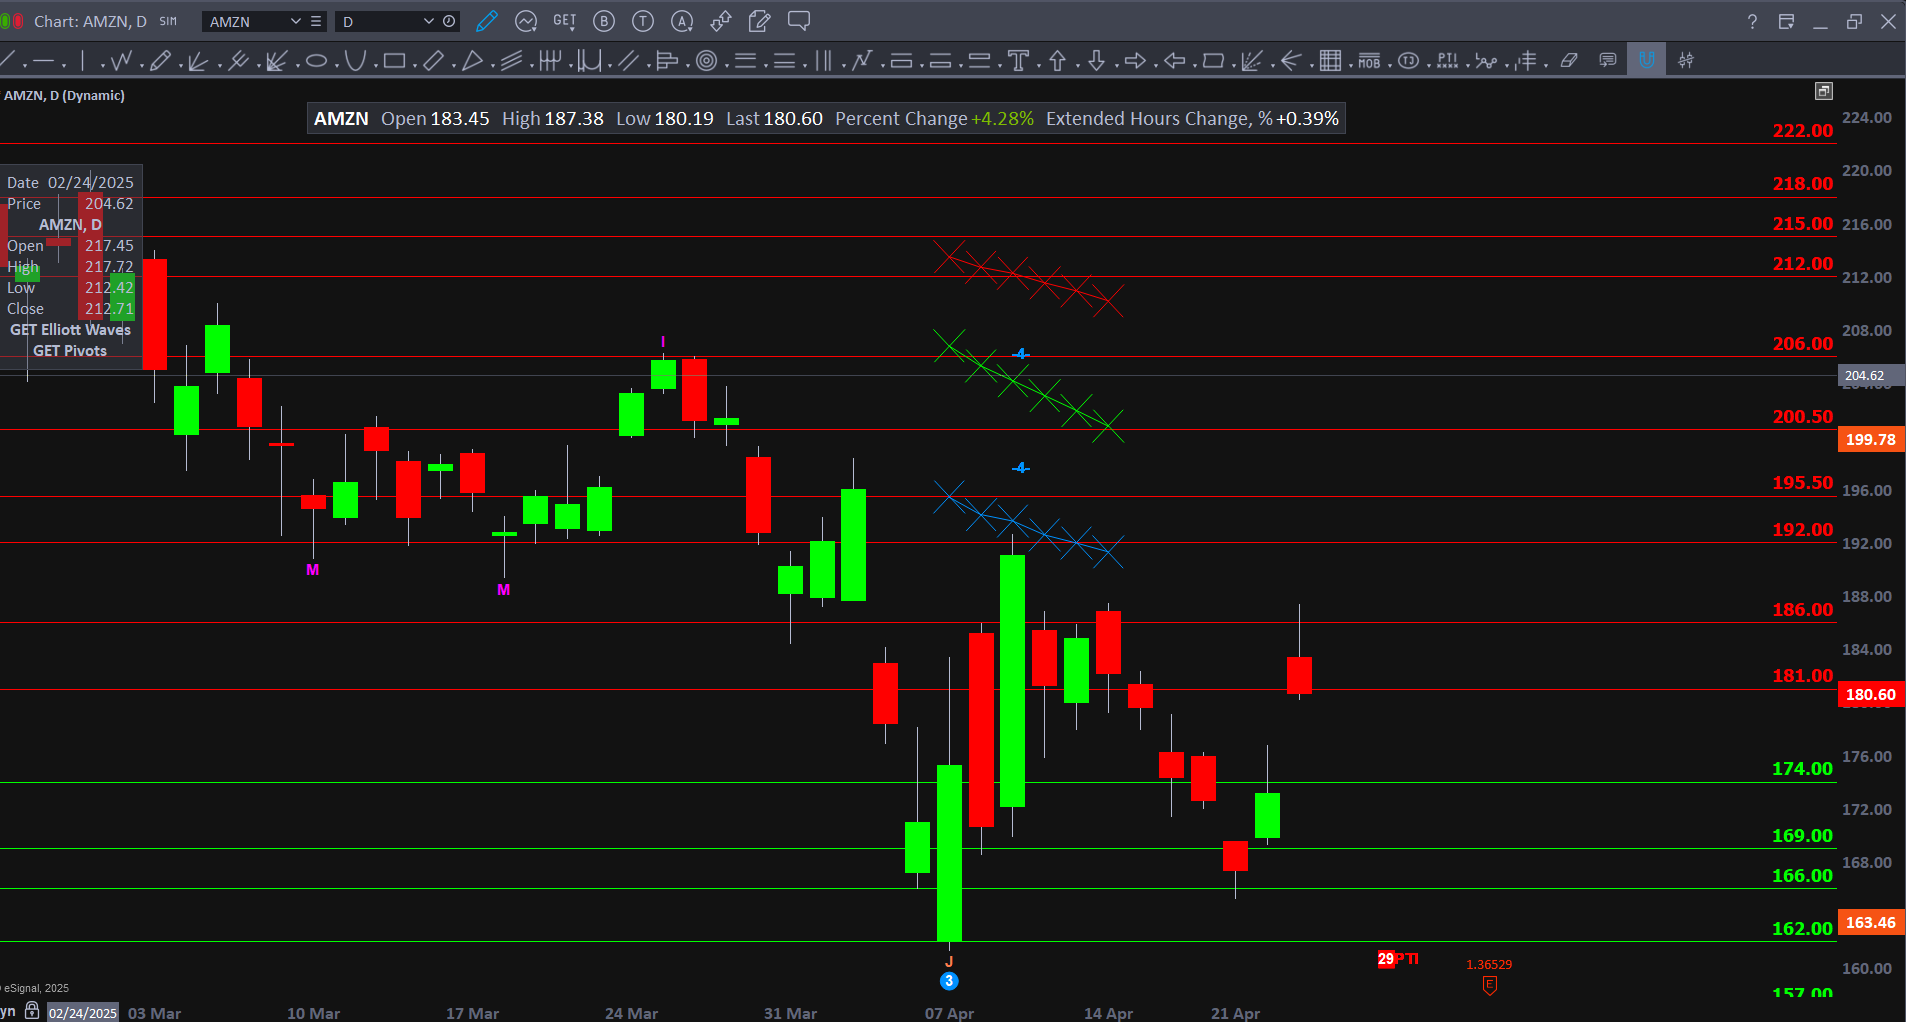
$AMZN closed at $180.60, up +4.28%, following a strong intraday move that helped recapture some lost ground. The stock has been under pressure but is showing signs of a short-term base forming near recent lows.
Key Levels to Watch:
Resistance Zones: $181 → $186 → $192 → $195.50
Support Levels: $174 → $169 → $166
Major downside pivot at $163.46 remains critical.
$AMZN Daily Chart
(Click image to enlarge)
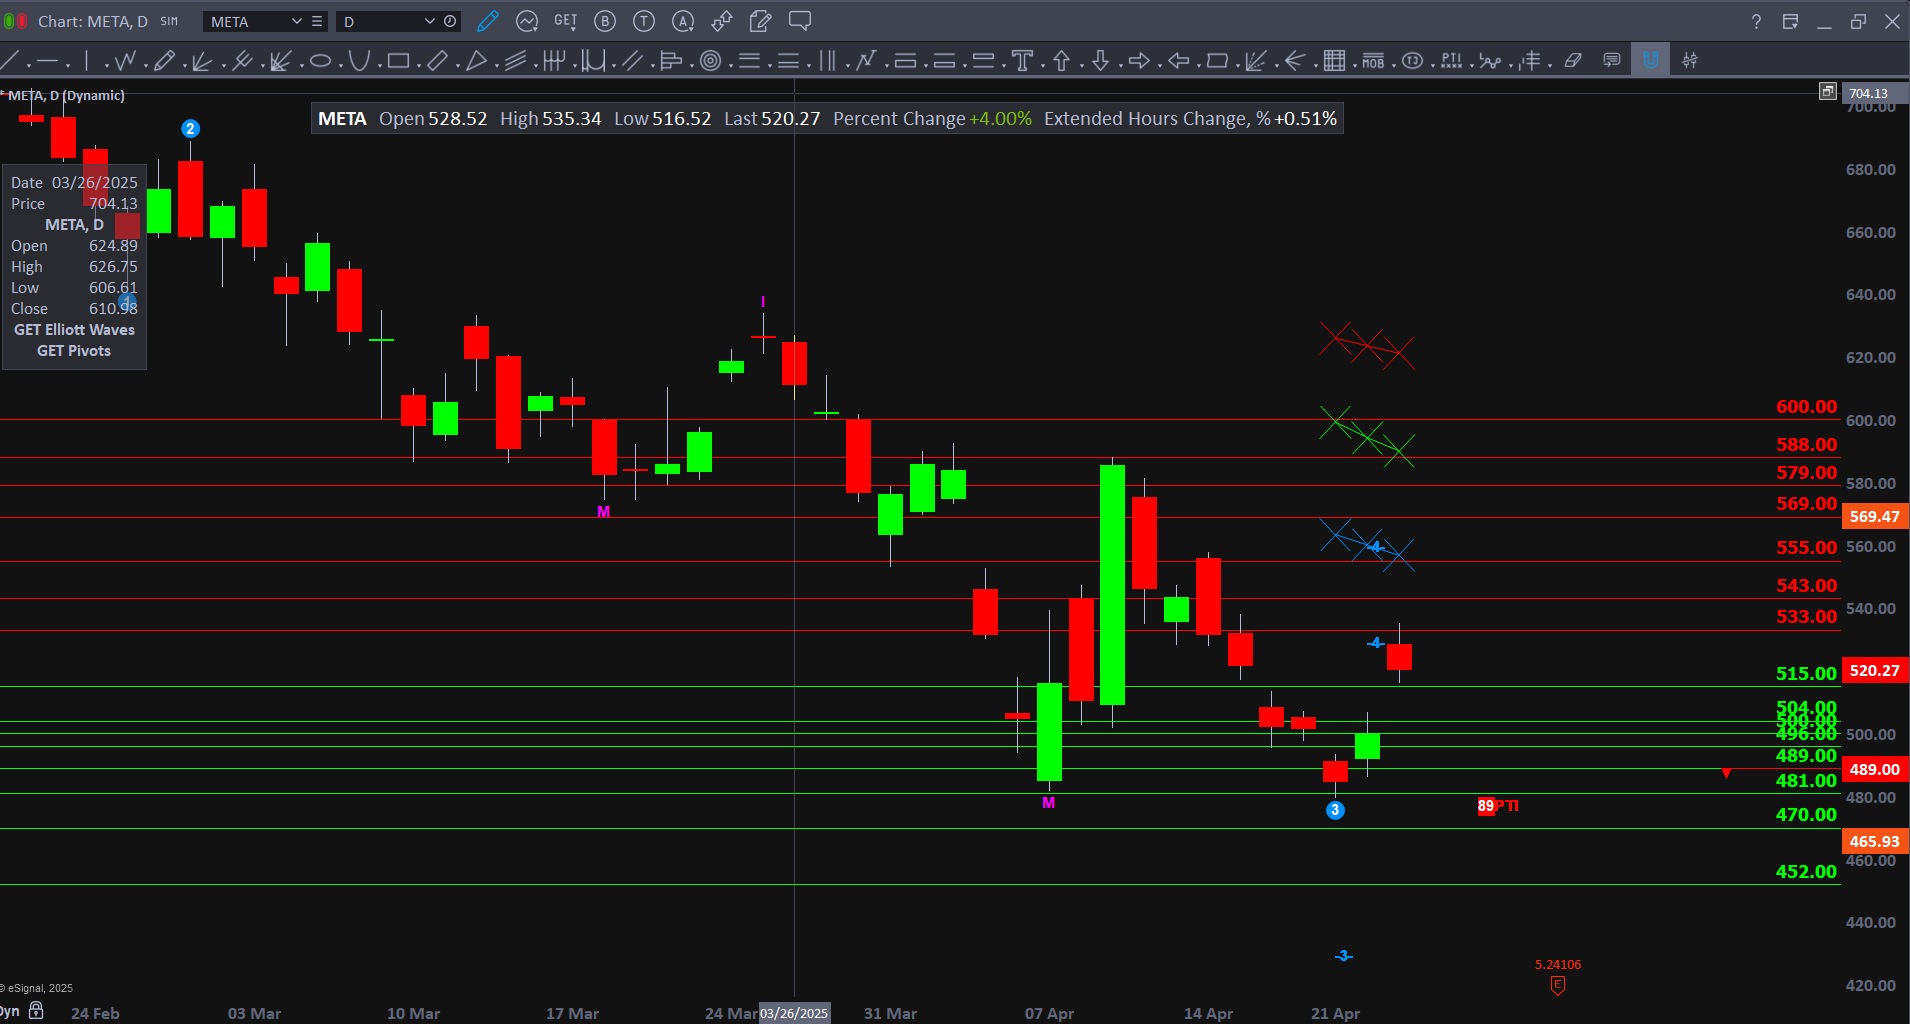
$META Technical Snapshot – April 23, 2025
$META – Technical Snapshot
$META closed at $520.27, up +4.00%, following a strong bounce off the $481 support zone earlier this week. The stock is trying to reverse recent downside pressure but still has work to do to reclaim lost levels.
Key Levels to Watch:
Resistance Zones: $520 → $533 → $543 → $555
Support Levels: $515 → $504 → $500 → $489
Major downside pivot at $470 remains in play.