REWARD RISK ANALYSIS

Grow Your Portfolio with Consistent Success 


Master the art of trading and achieve consistent profitability in any market condition.

Start making winning trades today with expert guidance and real-time insights.

🔹 No commitments – All memberships renew automatically, and you can cancel anytime.

REWARD/RISK ANALYSIS 

Before entering any trade, we want to have three key price levels identified;


  • Entry Price
  • Stop Price
  • Target Price


When we have these price levels identified, we can calculate the Reward/Risk Ratio of the trade. As discussed in The Risk Management module, we only want to take trades that have a high Reward/Risk ratio, this helps us “keep our losers small and our winners big,” and is a key part of maintaining healthy trading statistics and consistent profitability.


Entry Price Determination


We use the trade entry criteria rules from module four part one to determine our entry price.
Let’s look at an example from each trade setup and its entry criteria to find Entry Prices.


Wave 5 Trend Continuation


See below image


Click image to enlarge


Above image shows KWEB on a daily chart. This is obviously a Bearish trend. Waves 1-4 are labeled.

All of the rules for a Wave 5 Trend Continuation trade have been met, except for the final one; we have a Lower-Low and Lower High, we just need New Low AFTER Wave 4.


Notice thered line that is drawn on the chart. It is at $28.55. This is the price level that is one tick below the previous Lower-Low (after Wave 4 was confirmed and the Oscillator went negative.) This will be a New Low and is our Entry Price for this trade.


What if you find a chart like this and the entry price has already been hit? Can you still take the trade? Yes! As long as the Reward/Risk is good and we will cover that calculation at the end of this post.


Wave 4 Correction


See below image


Click image to enlarge


Above image shows SE on a daily chart. This chart has been in a massive Wave 3 downtrend for over a year. It started well before the data shown, but it is zoomed in to show the Wave 4 correction beginning.


All of the Wave 4 rules are met for this trade (they are, even though Wave 1 and 2 are outside of the picture.)


The new Higher-High, Higher-Low and the New High are labeled on the chart.


The Green line marks the Entry Price for this trade, as a New High is put in as Wave 4 proves that it is beginning. It may be hard to see on this Figure, but the entry price is at $68.79, one tick above the previous Higher-High.


New Trend
 

See below image


Click image to enlarge


Above image is KWEB again on a daily chart.


Notice that five waves down have completed and that the rules for a new trend beginning are nearly met. All we need is a New High. The Higher-Higher and Higher-Low, after the five waves down, are marked on the chart. The Green line show the Entry Price of $27.43.


Stop Price Determination


We use support and resistance levels, often from previous Highs or Lows, to determine our Stop Price. What we are looking for in an initial Stop Price is a level, that if hit, will cause our thesis about the trend direction to be invalidated. This is the level that we would want to be out of the trade at.


Let’s look at an example from each trade setup to find Stop Prices.


Wave 5 Trend Continuation
 

See Figure 4.3.4


Click image to enlarge


Above image shows KWEB on a daily chart.

We’ve just added the Stop Price. Notice the Red Line drawn on the chart. This is the Stop Price and is one tick above the previous High at $32.15. 


Wave 4 Correction
 

See below image


Click image to enlarge


Above image is the same example from the Wave 4 setup, SE on a daily chart.

We have added the Red Line for the stop at $48, one tick below the previous Higher Low.


New Trend
 

See below image

Click image to enlarge


Image above is the New Trend example of KWEB on a daily chart. We have added a Red Line for the initial Stop Price at $17.19, the bottom of Wave 4. Once a New High is put in, the Stop Price will move to the Dashed Red Line at $23.95. A conservative (and legitimate) way to approach a trade setup like this example would be to leave the Stop Price at the bottom of Wave 4 until the trend really gets underway, and then trail it up to new Higher-Low and Higher-High are put in. This gives price room to move as the trend gets established. The impact of the lower stop is a smaller position size (review the post on Risk Management and Trade Size if that is not intuitive for you at this point.)


Target Price Determination


We use Fibonacci extensions, Fibonacci retracements and support and resistance levels to determine our Target Price.

These prices expressed in a range. We cannot predict exactly where prices are going to go in the future, but we can predict a range with very high probability.


In calculating our Reward/Risk ratio for the trade, we use the lower Price Target. This is a conservative approach and helps ensure that the Reward/Risk ratio for the trade is good, even at the lower Price Target. If the price ends up going higher, all the better!


Let’s look at an example from each trade setup to find Target Prices.


Wave 5 Trend Continuation
 

See image below

Click image to enlarge


Above image is KWEB is the Wave 5 trade again.

This time we have added the dashed Green Line at the Target Price  $14.70.

Remember that the price target zone for a Wave 5 trade is the Fibonacci Extension levels of 61.8% - 100%. Notice that the Target Price is set one tick below the 61.8% extension line at $32.13. This is the conservative Price Target – of course it could go lower and that would be great, but we base our analysis on the more conservative level.


Wave 4 Correction
 

See below image


Click image to enlarge


Above image SE, once again, on a weekly chart. In this image we have added the dashed Green Line at the Price Target of $114.17. Remember , the expected retracement for Wave 4 is 38.2% - 61.8%.

Our price target is set one tick above the 38.2% retracement. This is the conservative Price Target – of course it could go higher and that would be great, but we base our analysis on the more conservative level.
 

New Trend
 

See below image


Click image to enlarge


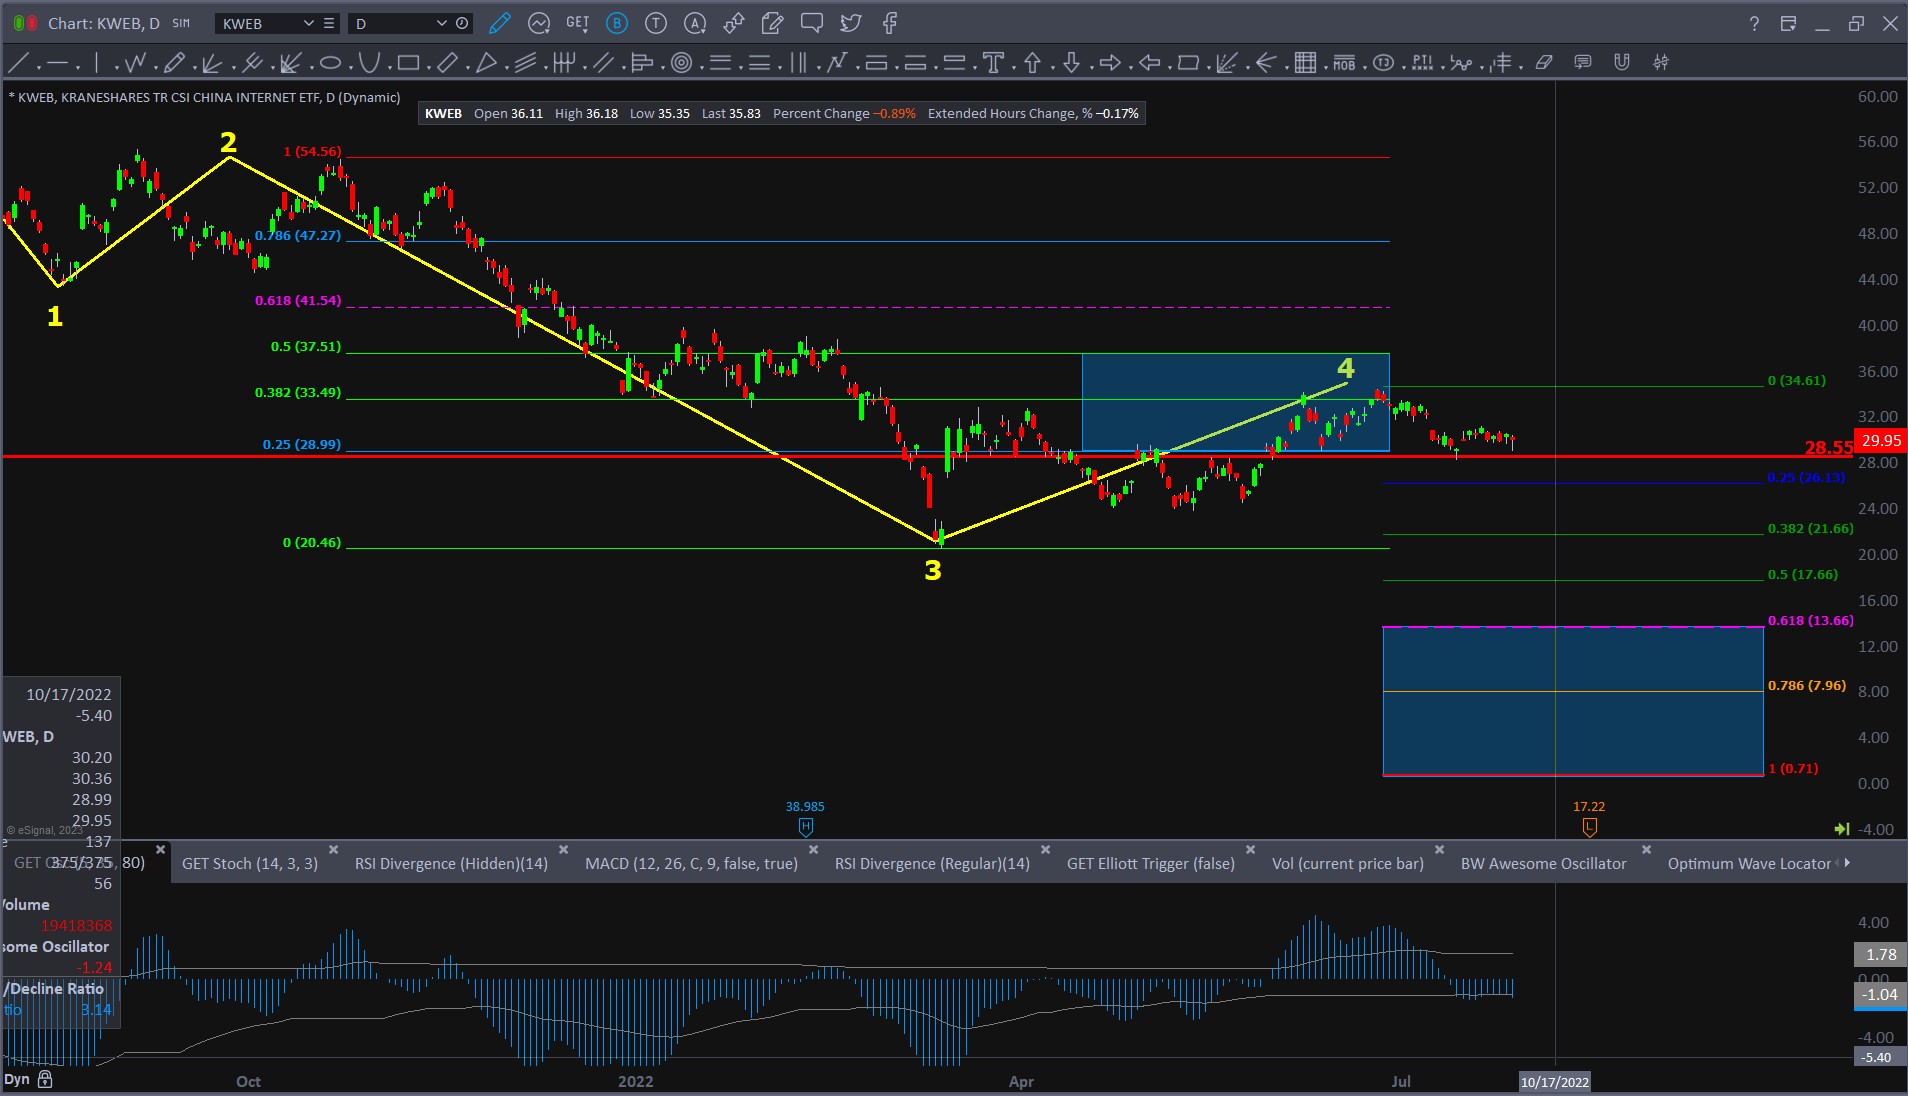
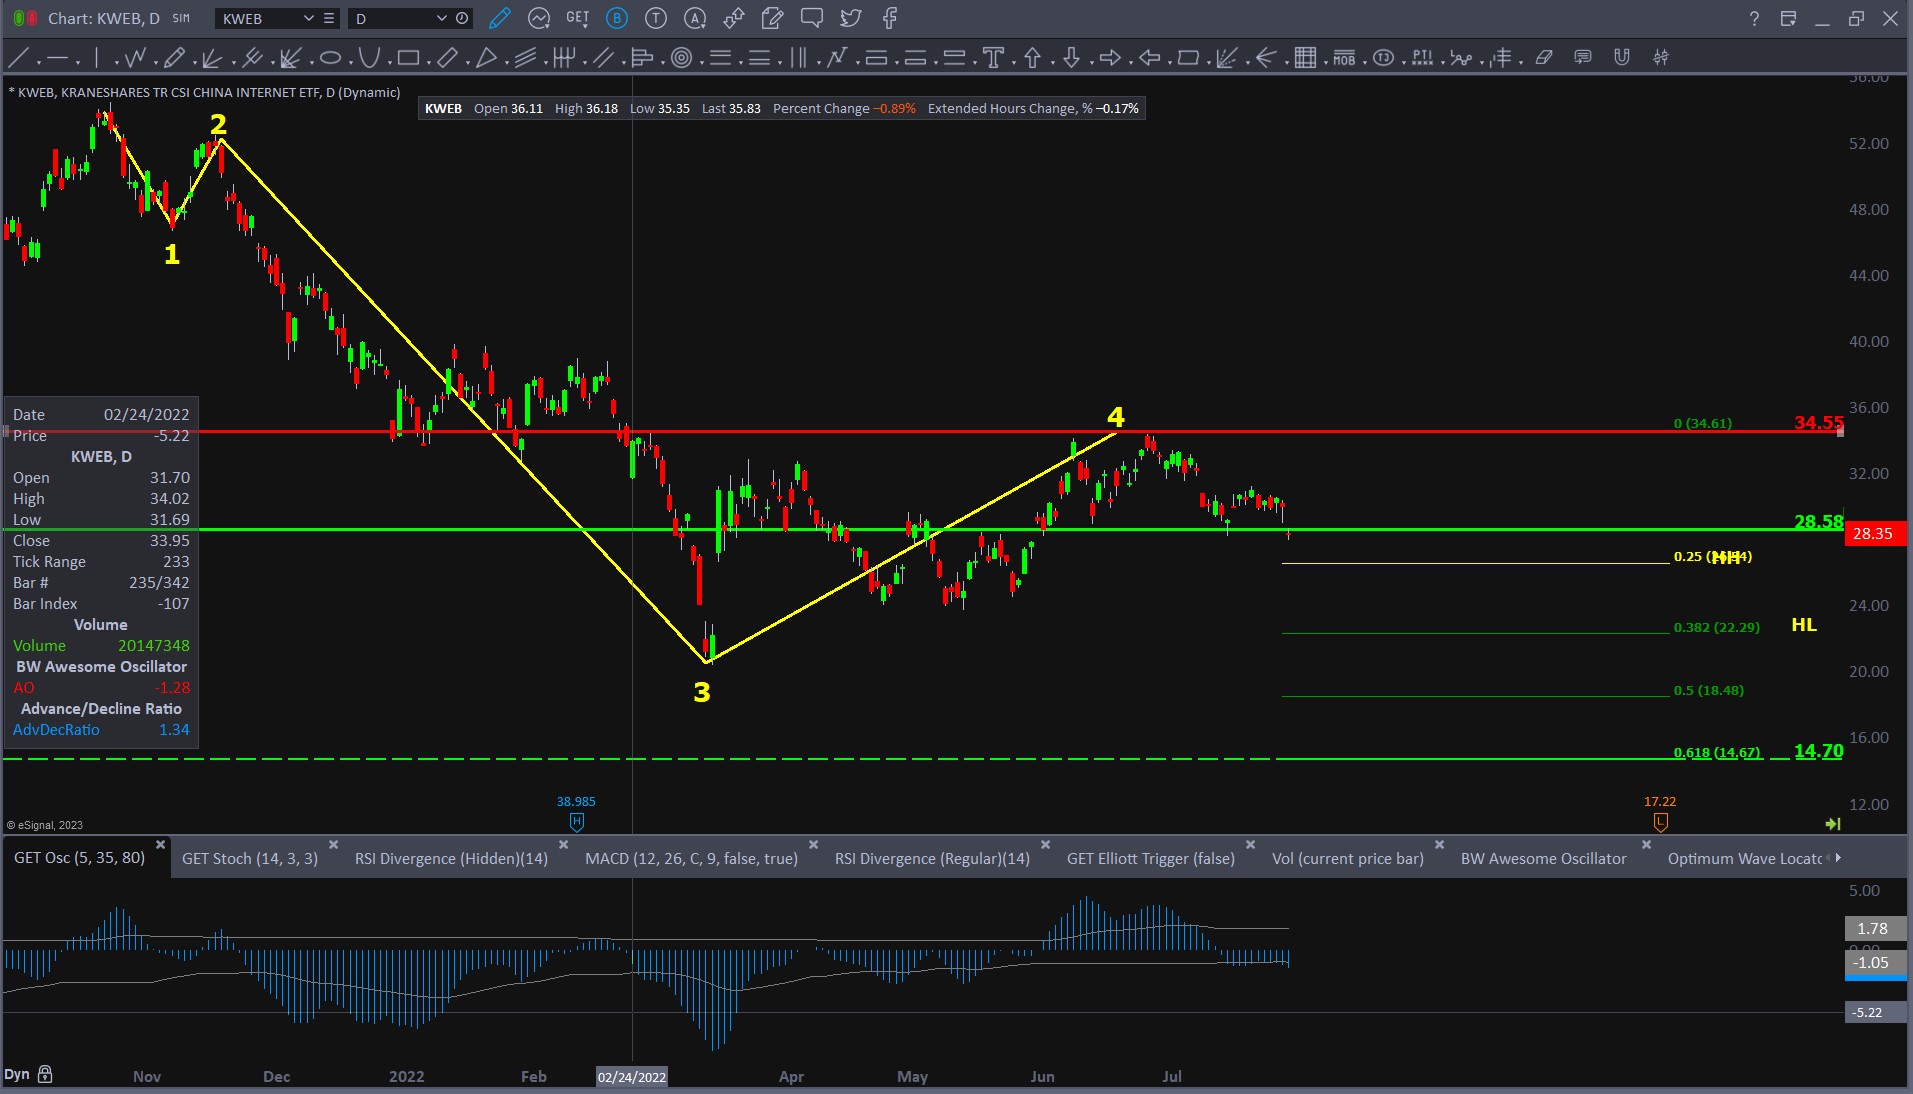
Above image is the KWEB New Trend trade.


Determining Price Targets for New Trends is the most difficult. We don’t have the precision of Fibonacci retracement or extension lines to work with like we do on the other two setups.

New Trends have the potential for greater returns than the other setups, but again, determining targets is difficult and at best is a guess.


The way we overcome this and establish targets to use in our Reward/Risk calculations is to identify previous resistance or support levels and use them as our targets. These aren’t so much targets as they are price levels that the trade could reverse from. Although they are not technically price targets, these price levels give us a way to determine if the trade has good reward potential.


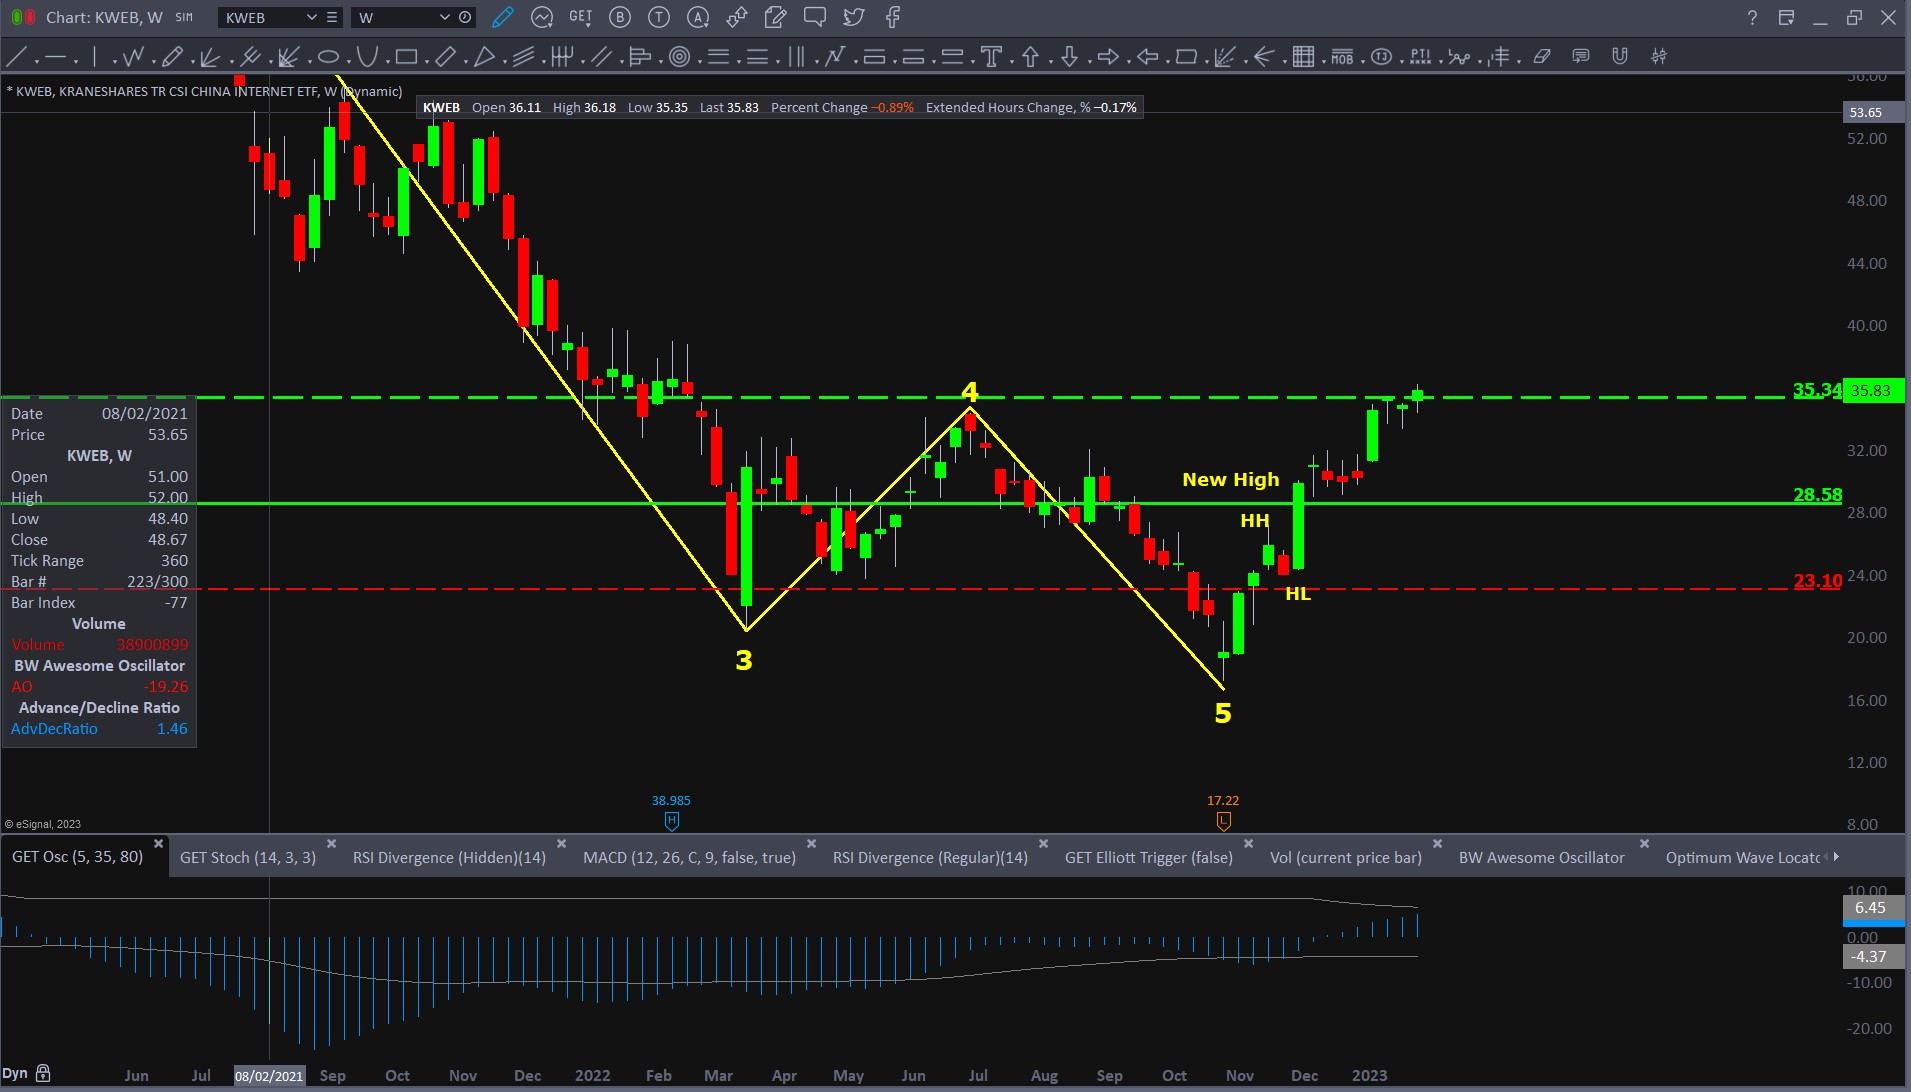
In above image, we have identified a key previous resistance level, which you can easily see on the chart and we have set our initial Price Target a few ticks below it at $35.34, which is marked by the dashed Green Line.


Now that we have the Entry, Stop and Target Prices identified, we can calculate the Reward/Risk Ratio for the trade. The math behind this is very simple.


  • Step one:

Calculate the “Risk Per Share” by subtracting the Stop from the Entry (Entry from Stop for Short trades.)


  • Step Two:

Calculate the “Reward Per Share” by subtracting the lowest Target from the Stop (Stop from Target for Short Trades.)


  • Step Three:

Divide the Reward per Share by the Risk per Share to get the Reward/Risk Ratio.


We did the maths for you, we have prepared an online calculator to help you for the maths

Click the image below to do the maths online.


Click image to visit the online Size/Risk Management Calculators


Remember, we want to keep our “winners big and our losers small.” That means we want to have
as large a Reward/Risk ratio as possible.


We recommend that you only take trades that have a Reward/Risk ratio of at least 1.2 and much
higher if possible.