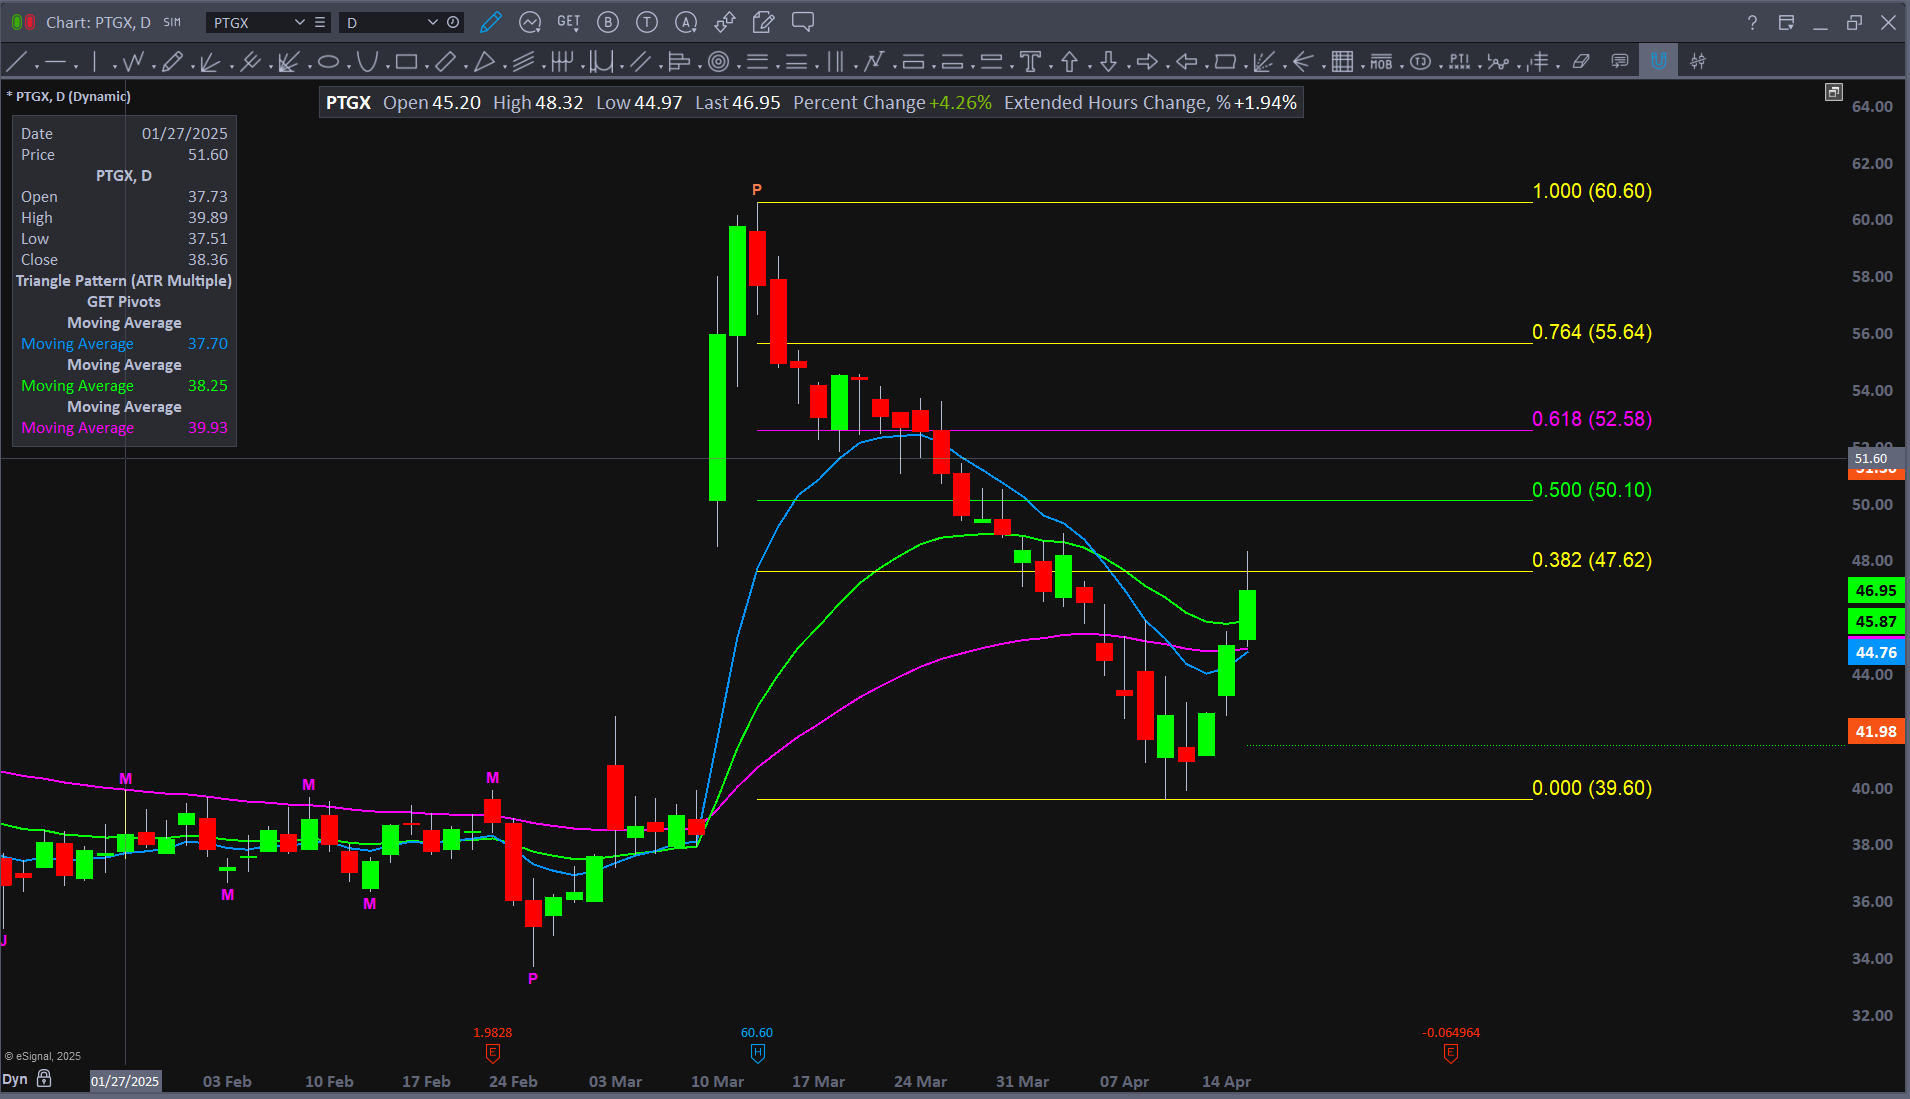
📊 $PTGX Technical Analysis (Daily Chart)
Current Price: $46.95
Trend: Recovering from a steep downtrend, showing short-term strength
Fib Levels (From high $60.60 to low $39.60):
0.382: $47.62 (currently testing)
0.500: $50.10
0.618: $52.58
Moving Averages (short-term support):
9 EMA: $44.76
21 EMA: $45.87
50 MA: $44.89
🔍 Key Observations:
Today’s candle is testing the 38.2% Fib retracement at $47.62 – a common reaction zone in bear market rallies.
Strong bounce off the lows near $39.60 with momentum, but still below the 50% and 61.8% retracement levels — these are key resistance zones if rally continues.
Volume not shown, but price behavior suggests a short squeeze or momentum bounce.
The cluster of moving averages around $44–$46 now serve as support.
🧭 Trade Plan
🔼 Bullish Scenario:
Trigger: Clear breakout and close above $47.62
Targets:
$50.10 (0.50 Fib)
$52.58 (0.618 Fib)
Stop-loss: Below $45 (just under 21 EMA)
🔽 Bearish Rejection Setup:
Trigger: Rejection at or below $47.62, forming a topping candle (like a doji or shooting star)
Target zones:
$44.76 (9 EMA)
$41.98 (recent support)
Aggressive Target: $39.60 retest if overall market weakens
Stop-loss: Over $48.25 (above Fib + wick buffer)
⚠️ Notes
Watch for overall market direction — PTGX is still below major resistance zones.
Ideal for short-term swing or day trade, especially if volatility continues.