📊 $NVDA (Nvidia) – Daily Technical Analysis & Trade Plan
Price Stats:
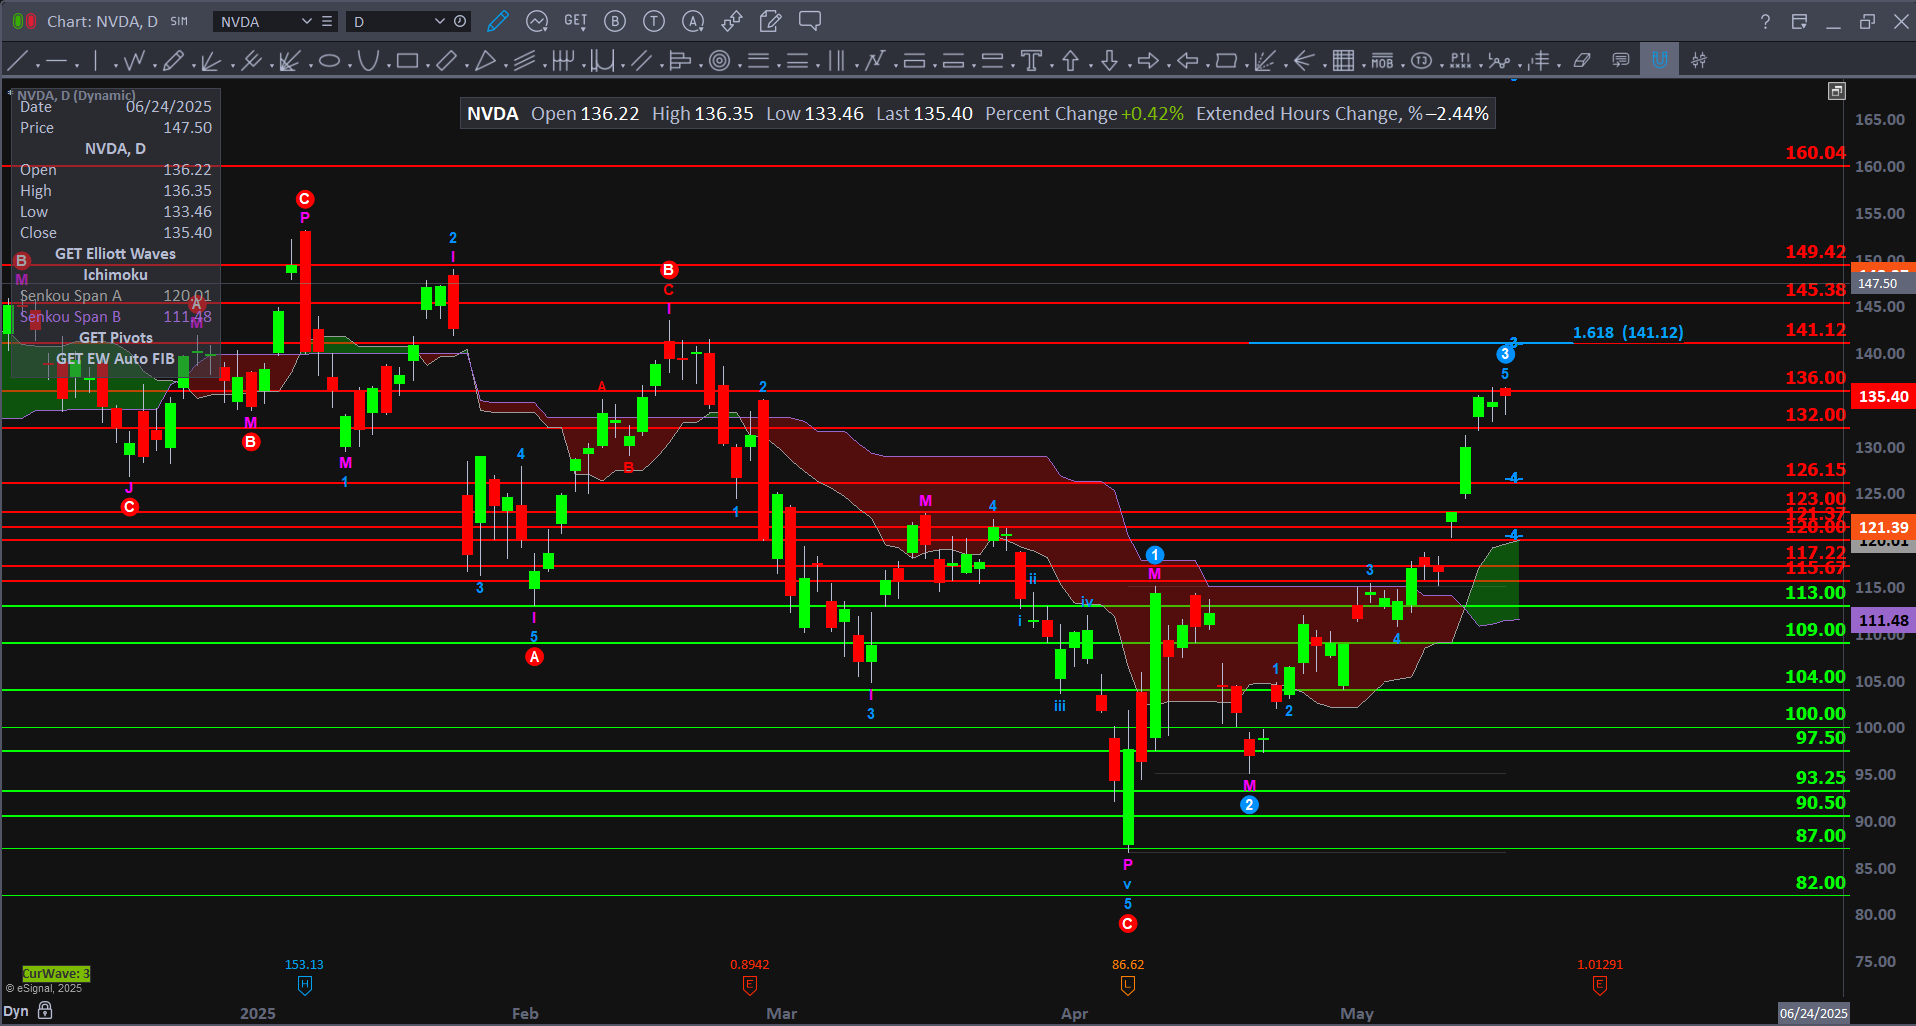
Open: 136.22 | High: 136.35 | Low: 133.46 | Close: 135.40 | Change: +0.42%
🔍 Technical Structure:
Wave Analysis:
$NVDA is in a strong Wave 3 advance, confirmed by the breakout above the previous resistance zone near 126.15 and the clean push through 132.00–136.00. The impulsive nature of the rally with expanding price range supports the bullish Elliott Wave count.
Momentum & Breakout Confirmation:
Wave 3 has now extended toward the 1.618 Fibonacci extension at 141.12, which serves as the first major target. Price is well supported by prior resistance at 132.00, which now acts as a breakout base.
Fibonacci Target Zone:
Wave 3 projection targets include the 1.618 extension at 141.12, followed by a 2.618 extension at 169.60 as a stretch target.
🔼 Resistance Levels:
136.00 | 141.12 (1.618 Fib) | 145.38 | 149.42 | 160.04 | 169.60 (2.618 Fib)
🔽 Support Levels:
132.00 (breakout base) | 126.15 | 123.00 | 120.00 | 117.22 | 113.00 | 109.00
✅ Bullish Scenario:
Trigger: Break and close above 136.00
Trade Setup:
Entry: Above 136.00
Targets: 141.12 → 145.38 → 169.60
Stop: Below 126.15
⚠️ Bearish Scenario:
Trigger: Failure to hold above 132.00 support
Trade Setup:
Entry: Below 132.00
Targets: 126.15 → 120.00
Stop: Above 136.00
🧭 Strategy Notes:
$NVDA has completed a clear Wave 2 correction and is accelerating through Wave 3 with bullish momentum. A close above 136.00 and sustained action above 132.00 would keep bulls in control and maintain a clean path toward the 141.12–145+ region. Watch for short-term consolidation before continuation.