📊 $MSFT (Microsoft) – Daily Technical Analysis & Trade Plan
Price Stats:
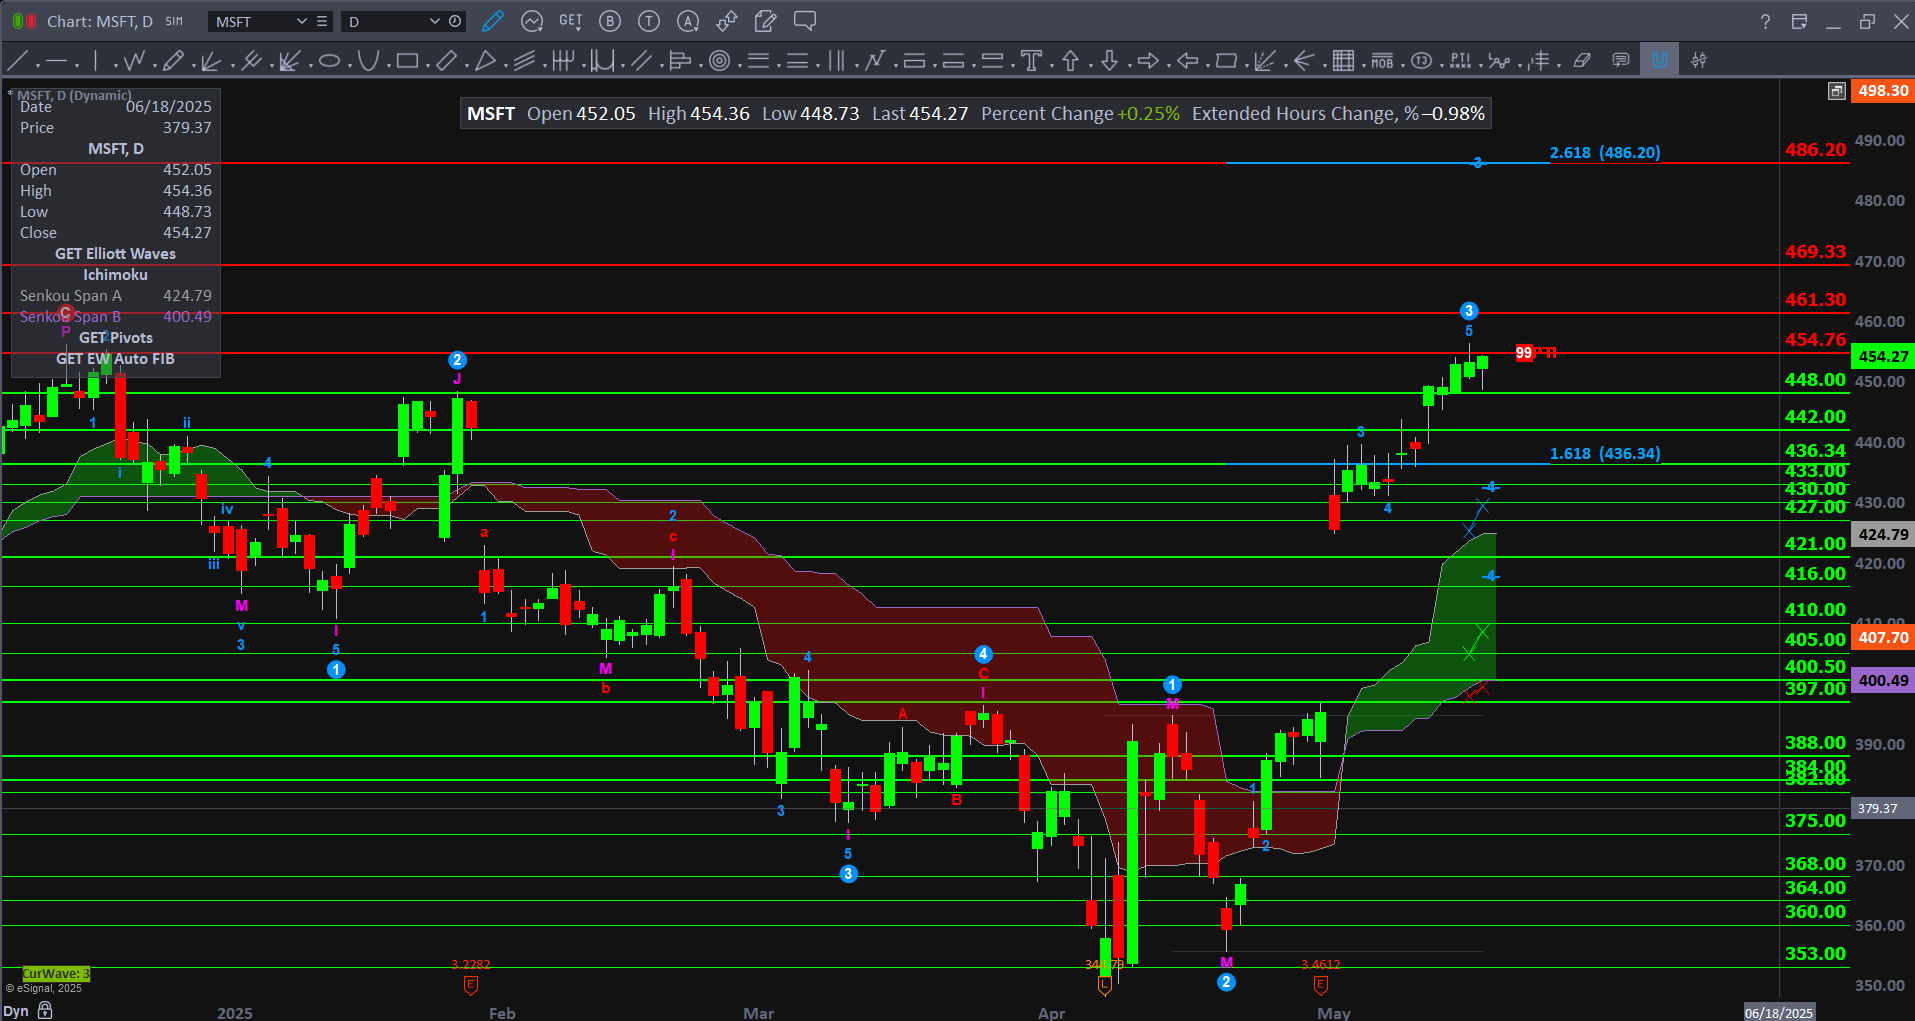
Open: 452.05 | High: 454.36 | Low: 448.73 | Close: 454.27 | Change: +0.25%
🔍 Technical Structure:
Wave Analysis:
$MSFT is currently advancing in what appears to be a Wave 3 to the upside, following a successful Wave 2 retracement and breakout from the Ichimoku cloud. The price has maintained higher lows and higher highs, signaling strong bullish momentum.
Momentum Confirmation:
The breakout above 436.34 (1.618 Fib extension) confirmed bullish continuation. Price is now consolidating just below resistance at 461.30, preparing for the next push higher.
Fibonacci Extensions:
Current wave projection targets the 2.618 extension at 486.20 as the next potential upside milestone.
🔼 Resistance Levels:
454.76 | 461.30 | 469.33 | 486.20 (2.618 Fib)
🔽 Support Levels:
448.00 (recent high turned support) | 442.00 | 436.34 (1.618 Fib) | 433.00 | 430.00 | 427.00 | 421.00 | 416.00 | 410.00
✅ Bullish Scenario:
Trigger: Breakout and close above 461.30
Trade Setup:
Entry: Above 461.30
Targets: 469.33 → 486.20
Stop: Below 436.00
⚠️ Bearish Scenario:
Trigger: Breakdown below 436.34
Trade Setup:
Entry: Below 436.00
Targets: 433.00 → 427.00
Stop: Above 454.76
🧭 Strategy Notes:
$MSFT is showing textbook bullish wave extension behavior, with current positioning supportive of continued upside. Watch for volume confirmation on the breakout above 461.30 to validate a move toward the 2.618 Fibonacci target at 486.20.