Elliott Waves Trades
By Pavlos D

- The typical time that I hold each Stock or ETF is one month to a few months.
- I primarily analyze the Price Patterns on the chart. I don’t study earnings reports or company forecasts.
- I believe strongly that “Fundamentals” like earnings, products, management, etc. do matter.
- I also believe that the price of a stock is a reflection of what the market thinks of a company’s fundamentals that everything that is known about a company is reflected in the Price Patterns on the chart.
- A stock’s price movement is based on what the market believes about the company.
These price movements sometimes have a clearly discernable pattern that can provide a basis for
predicting the next price move.
- Price and Volume are the only realities in the market – everything else is subject to interpretation, manipulation, speculation and emotion. I base my analysis on the realities of Price and Volume that present themselves in price patterns on the chart.
*While I base my analysis on Technicals, I do check some key things about a company before taking a
trade. Things like; Bankruptcy filing, acquisition announcements, etc.
Trading Criteria
- The Trade is in the direction of the major trend of the overall market or sector.
- I do occasionally take “counter-trend” trades when the probability of winning is very high.
- The Trade has a High Probability of winning, based on my analysis.
- The Trade has a High Risk/Reward Ratio – meaning the Trade has the potential to make much more money than it will lose if the Trade fails.
- The Trade fits within my Risk Management parameters – it has a clear support or resistance level for my Stop Loss placement.
- The Trade has a high Capital Efficiency – meaning I do not tie up all of my trading capital in one or two trades, but rather try to only have ~10-15% of available capital in a given trade.
This is different than diversification.
• Out of 10 trades, 3-4 will fail, 6-7 will win, 1-2 will win REALLY big.
• I often by Put or Call options to improve the Capital Efficiency of my trades.
• My published picks include specific option contracts when appropriate.
• I do pay attention to Sector Weighting and limit Trade overexposure in sectors.
• Elliot Wave Theory
• Fibonacci Retracements and Extensions
• Esignal charting software
Elliot Wave Theory
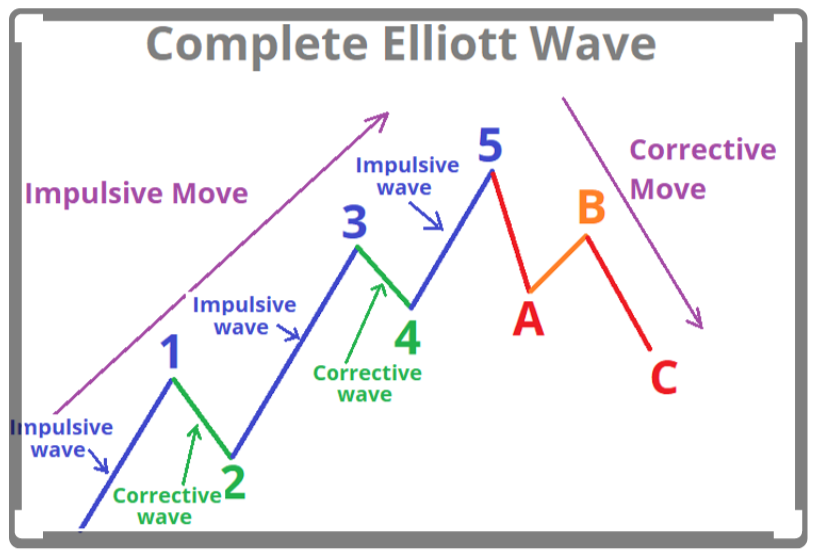
Ralph Nelson Elliott developed Elliot Wave Theory in the 1930’s. The Elliott Wave Principle posits that collective investor psychology, or crowd psychology, moves between optimism and pessimism in natural sequences – or waves – a series of impulsive and corrective waves
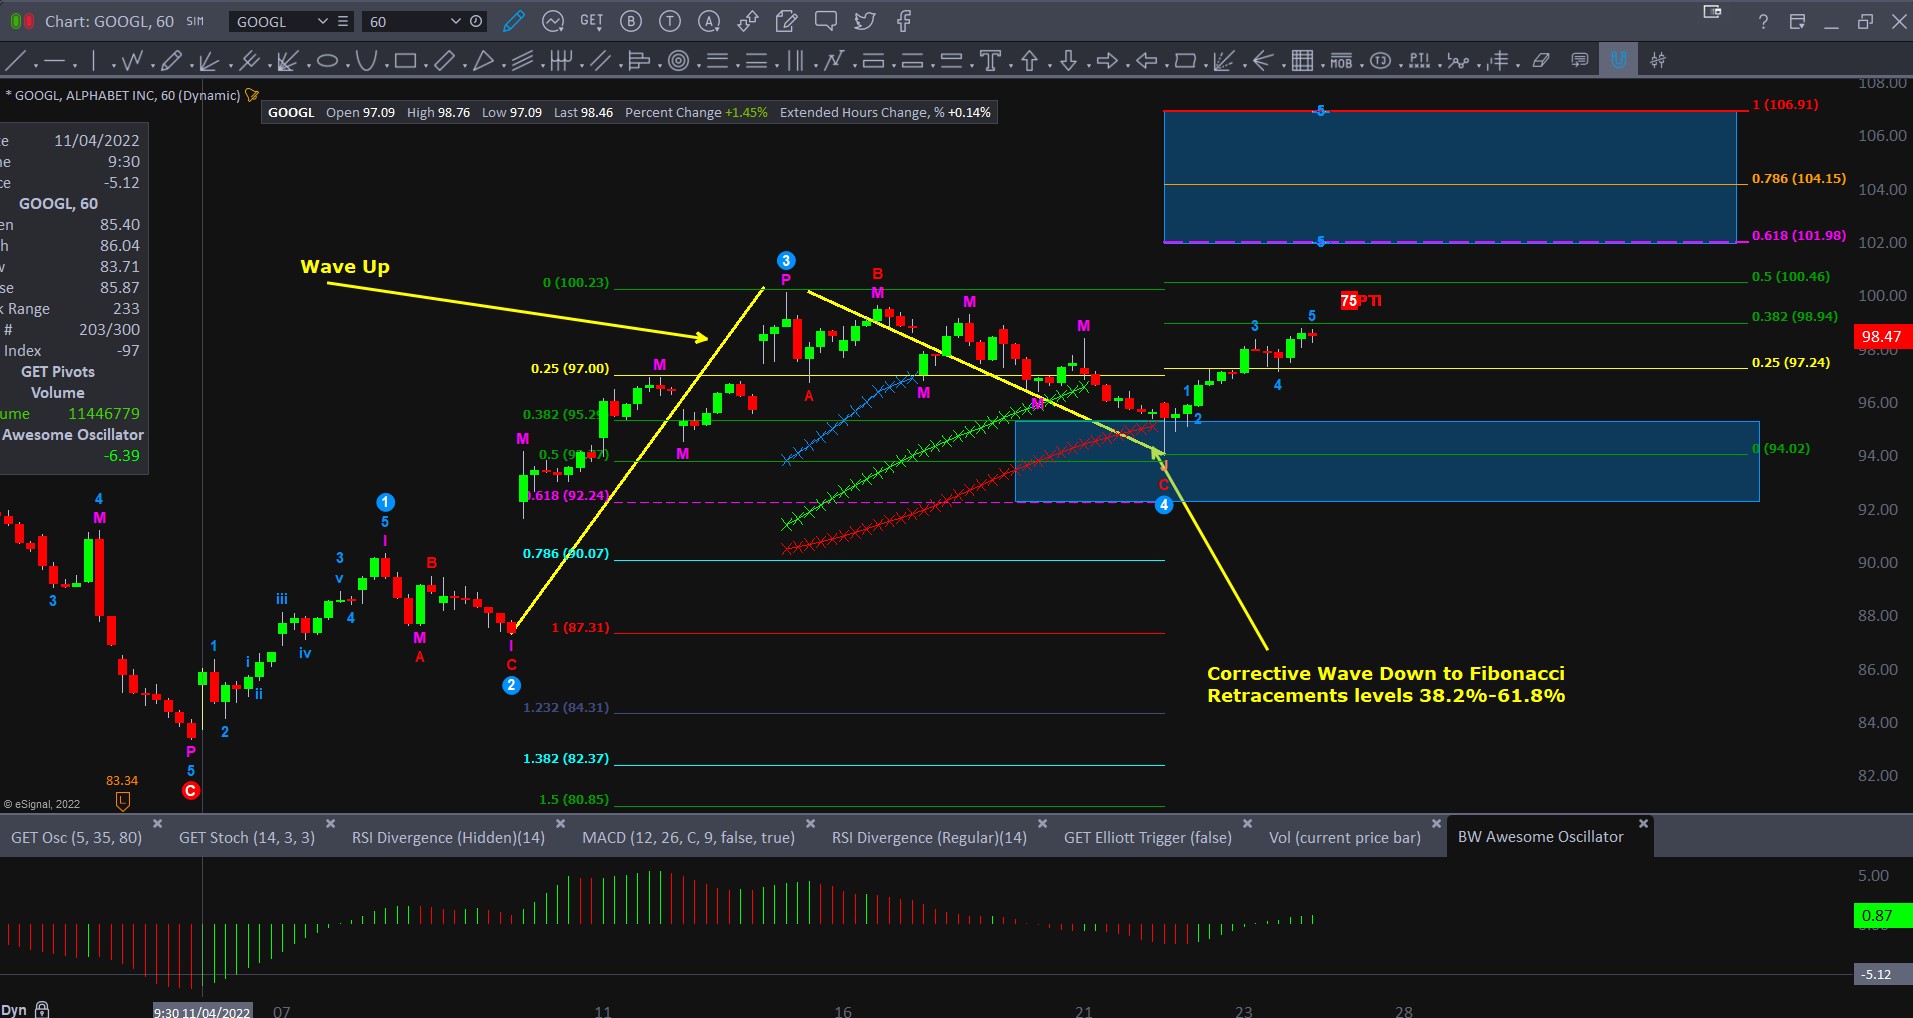
I seek to find trades for Wave 3 and Wave 5.
These are the “Impulsive” Waves with dramatic price movement.
Wave 3 and 5 can occur in either a “Bullish” uptrend or a “Bearish” downtrend.
The same principles and measurements apply.
I trade both Bullish and Bearish markets.
Fibonacci Numbers
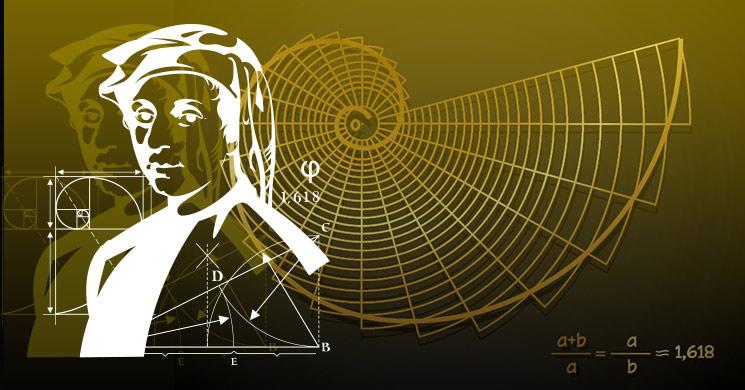
Leonardo Fibonacci was an important Italian mathematician from the middle ages (1170-1250.) His discovery of “Fibonacci Numbers” and their “Fibonacci ratios” is considered one of the most important mathematical concepts ever and is used widely by scientists, artists, economists, architects and in many other disciplines as well as appearing all around us in nature.
The Fibonacci Number sequence is: 0,1,1,2,3,5,8,13,21,34,55,89…
Starting with 0 and 1, the next number in the sequence is found by adding the previous two numbers (I.e.
0+1=1, 1+1+2, 2+1=3, 2+3=5…)
Fibonacci Ratios are the ratios of one number position to other number positions in the sequence.
• A number divided by the previous number approximates 1.618
• A number divided by the next highest number approximates .6180
• A number divided by another two places higher approximates .3820
• and so on…
The Ratio .6180 is called the “Golden Ratio” and appears all around us in the form of the shapes of things ranging from
snail shells and flower petals to pine cones, pineapple scales, spiral galaxies and hurricanes.
Fibonacci Retracements