📊 $GOOGL (Alphabet) – Daily Technical Analysis & Trade Plan
Price Stats:
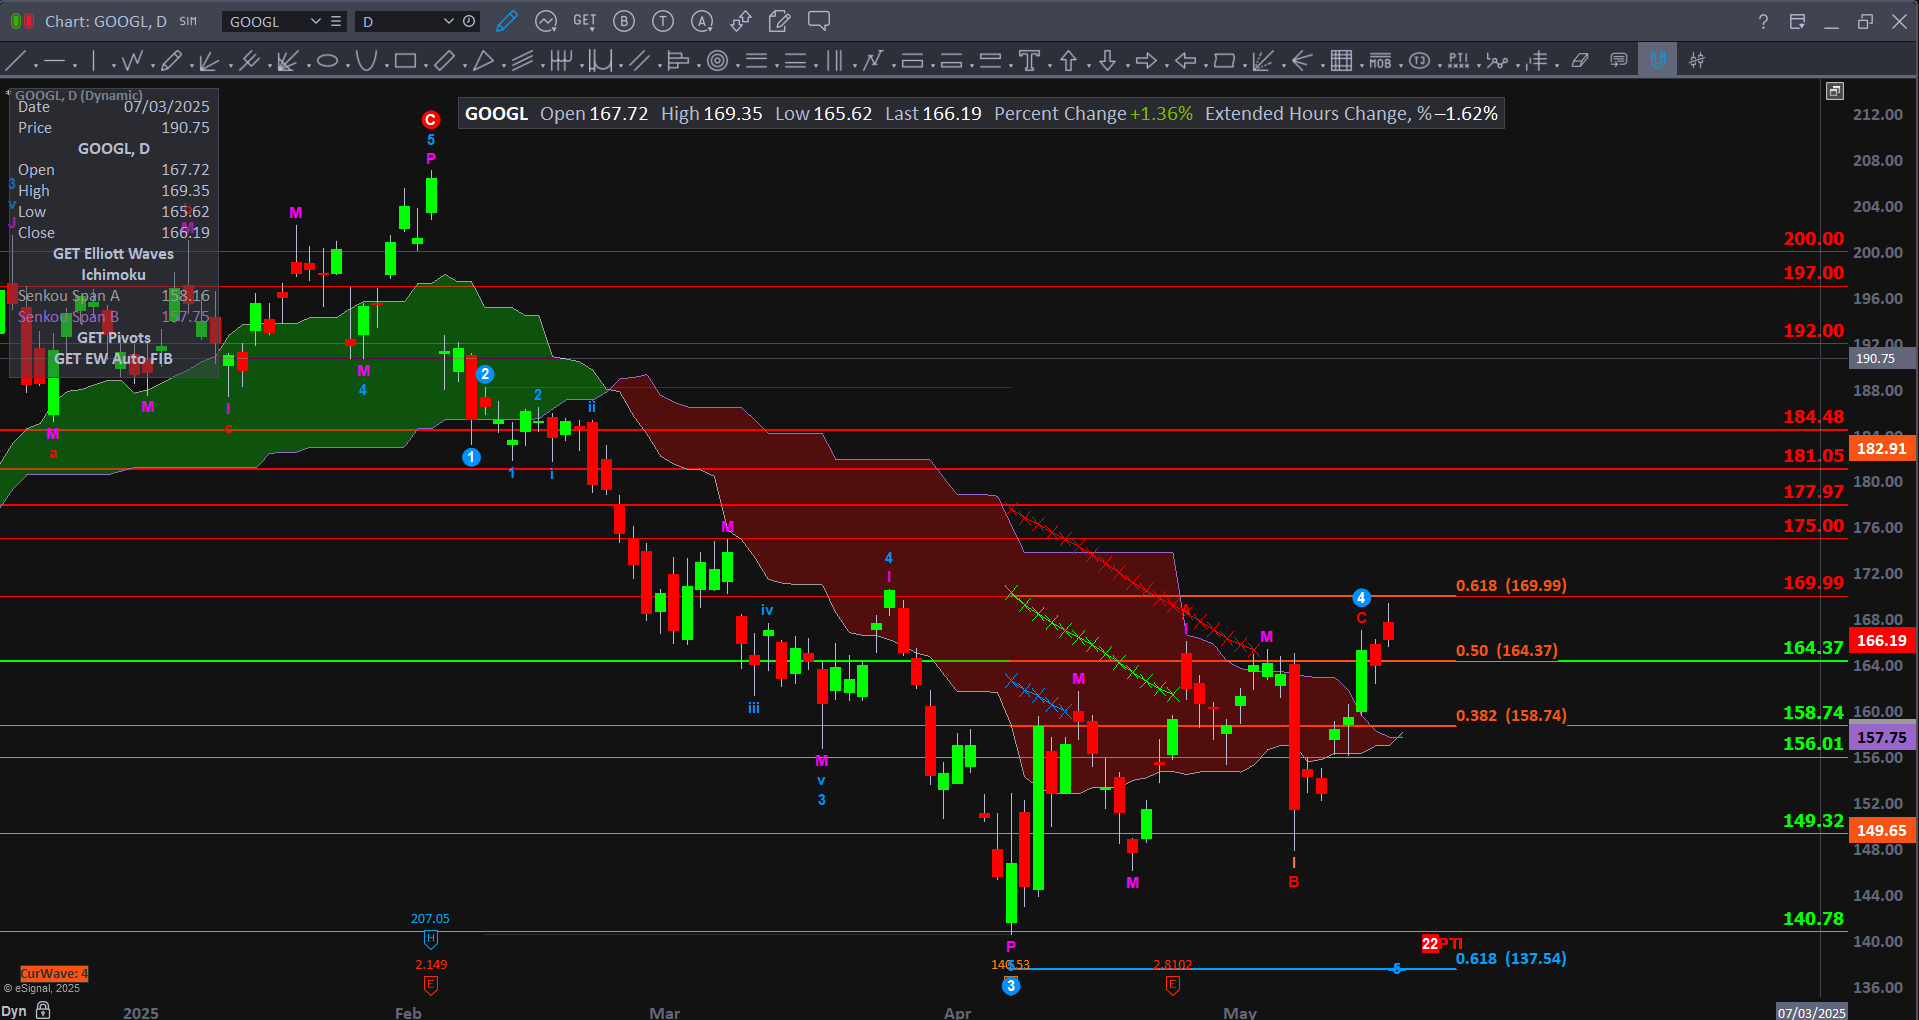
Open: 167.72 | High: 169.35 | Low: 165.62 | Close: 166.19 | Change: +1.36%
🔍 Technical Structure:
Wave Analysis:
$GOOGL is currently in a potential Wave 4 correction after completing a strong impulsive Wave 3 decline. The price has rebounded and tested the 0.618 Fibonacci retracement level at 169.99, which aligns with the top of the Ichimoku cloud—a classic resistance zone during corrective rallies.
Decision Point:
Price is now at a critical juncture. A confirmed breakout above 169.99 could signal the start of a new bullish sequence (invalidating the prior Wave 3 low). Conversely, failure here and a reversal below 158.74 could confirm Wave 5 to the downside.
🔼 Resistance Levels:
169.99 (0.618 Fib) | 175.00 | 177.97 | 181.05 | 184.48 | 192.00 | 197.00 | 200.00
🔽 Support Levels:
164.37 (0.50 Fib) | 158.74 (0.382 Fib) | 156.01 | 149.32 | 140.78 | 137.54 (0.618 ext.)
✅ Bullish Scenario:
Trigger: Breakout and daily close above 170.00
Trade Setup:
Entry: Above 170.00
Targets: 175.00 → 181.05 → 192.00
Stop: Below 158.74
⚠️ Bearish Scenario:
Trigger: Rejection at 169.99 and close below 158.74
Trade Setup:
Entry: Below 158.74
Targets: 149.32 → 140.78 → 137.54
Stop: Above 170.00
🧭 Strategy Notes:
$GOOGL is at a critical inflection point. A daily breakout above 169.99 would challenge the current bearish wave count and suggest the end of the Wave 4 correction. However, failure to break and hold above the Fib zone likely resumes the Wave 5 decline. This is a textbook wait-and-see moment for trend confirmation.