🛒 $AMZN (Amazon) – Daily Technical Analysis & Trade Plan
Price Stats:
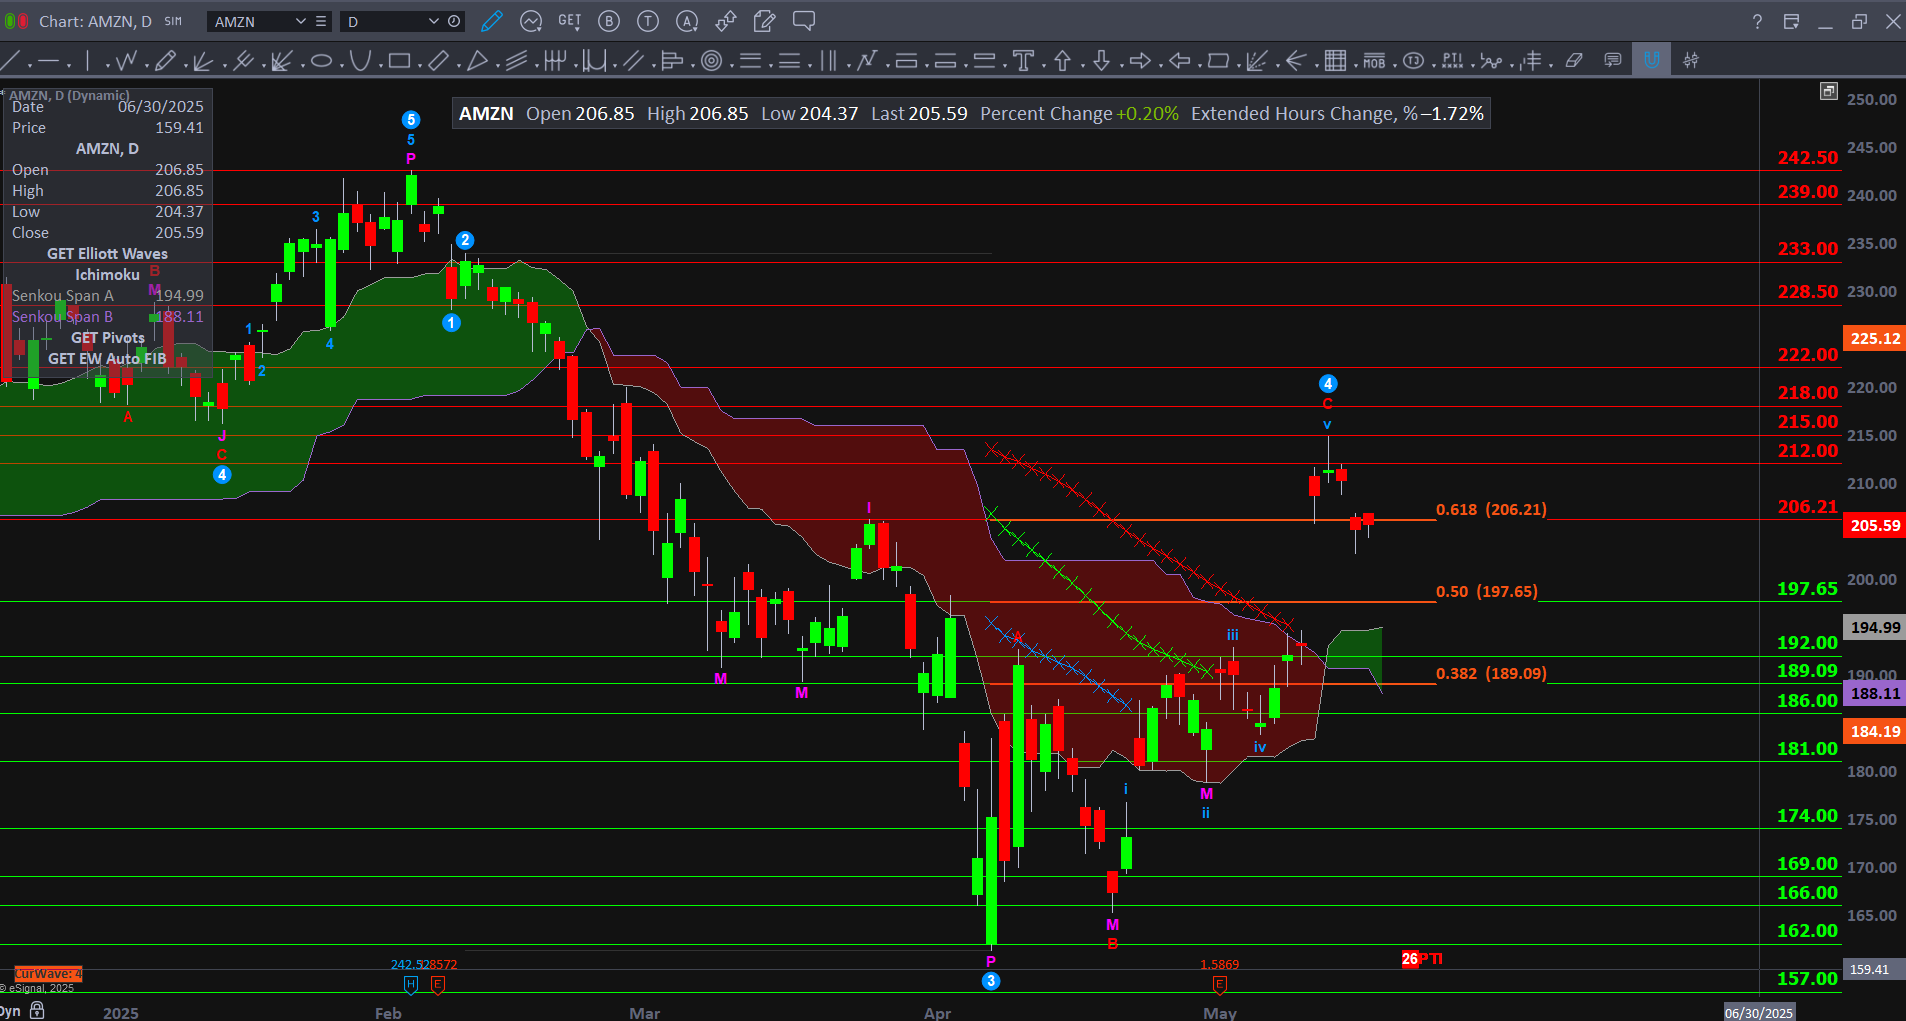
Open: 206.85 | High: 206.85 | Low: 204.37 | Close: 205.59 | Change: +0.20%
📈 Technical Structure:
Wave Analysis:
$AMZN appears to have completed a corrective Wave 4 near the 0.618 Fib retracement at 206.21, following a full Wave 3 decline. This level acted as both Fibonacci resistance and prior structure resistance, where price has started to stall.
Key Decision Point:
A sustained move above 206.21 could mark the beginning of a new impulsive uptrend.
A rejection at or below 206.21 increases the likelihood of a Wave 5 continuation to the downside.
🔍 Updated Key Levels – $AMZN
Resistance Levels:
197.65 | 206.21 (0.618 Fib) | 212.00 | 215.00 | 218.00 | 222.00
Support Levels:
197.65 (Fib 0.50) | 192.00 | 189.09 (0.382 Fib) | 186.00 | 181.00 | 174.00 | 169.00 | 162.00 | 157.00 | 152.00
✅ Bullish Scenario:
Trigger: Break and close above 206.21
Trade Setup:
Entry: Over 206.50
Targets: 212.00 → 218.00 → 225.00
Stop: Below 197.00
⚠️ Bearish Scenario:
Trigger: Rejection at or breakdown below 206.21
Trade Setup:
Entry: Below 197.00
Targets: 189.09 → 181.00 → 169.00
Stop: Above 206.50
🧭 Strategy Notes:
$AMZN has reached a critical inflection zone at the 0.618 retracement of the prior Wave 3.
A confirmed breakout above this level would shift structure into a bullish mode.
Failure here opens the door for Wave 5 continuation to retest and possibly break below prior lows.