📈 $AMD (Advanced Micro Devices) – Daily Technical Analysis & Trade Plan
Price Stats:
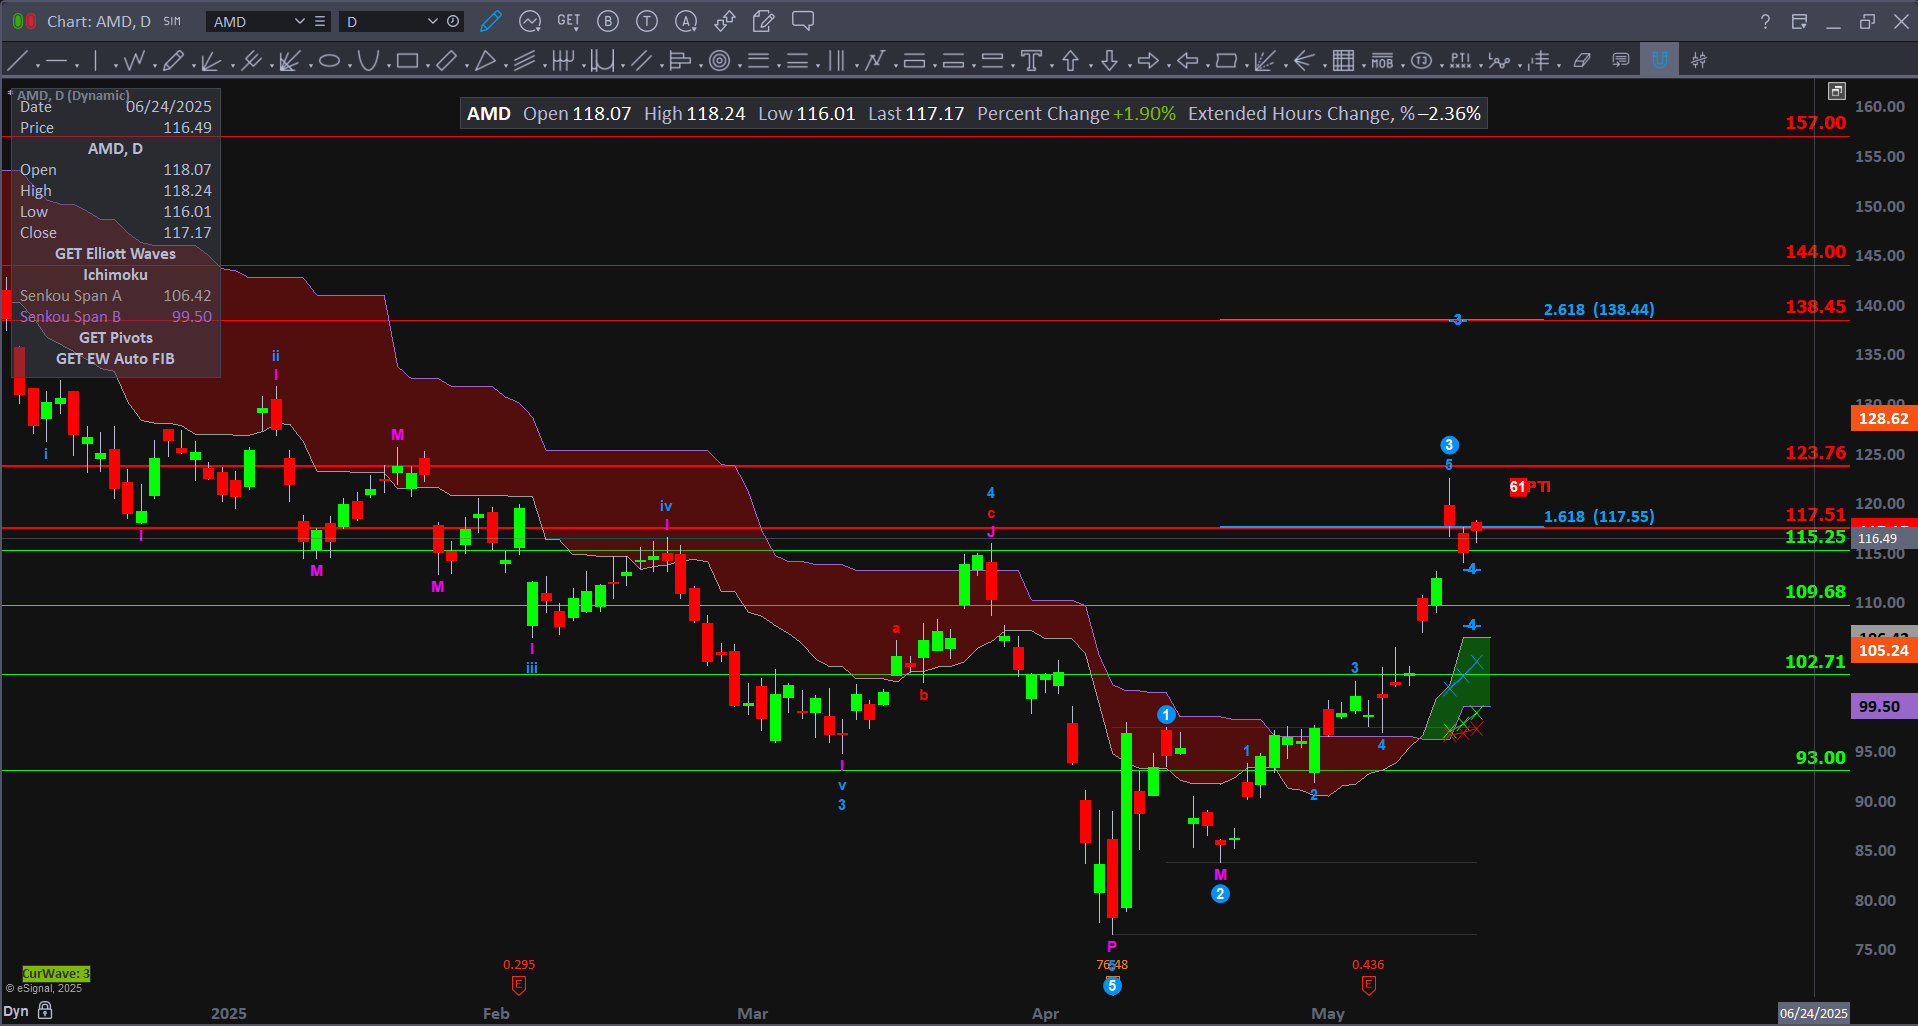
Open: 118.07 | High: 118.24 | Low: 116.01 | Close: 117.17 Change: +1.90%
🔍 Technical Structure:
Wave Analysis:
$AMD has completed its corrective structure and initiated a bullish impulsive move, currently in the early phase of Wave 3. The strong push above the Ichimoku cloud and the break of prior resistance confirm trend reversal characteristics. The current wave count and price action suggest Wave 3 is underway, with Fibonacci extensions marking potential targets.
Fibonacci Extension Targets:
1.618 extension: 117.55 (already hit, acting as current resistance)
2.618 extension: 138.45
4.25 extension: 172.53
📊 Updated Key Levels – $AMD
Resistance Levels (Horizontal):
117.55 | 123.76 | 128.62 | 138.45 | 144.00 | 157.00 | 172.53
Support Levels (Horizontal):
115.23 | 109.68 | 105.24 | 102.71 | 99.50 | 93.00
✅ Bullish Scenario
Trigger: Break and close above 117.55
Trade Setup:
Entry: Above 117.55
Targets: 123.76 → 138.45 → 172.53
Stop: Below 109.68
⚠️ Bearish Scenario
Trigger: Rejection at 117.55 with a close below 109.68
Trade Setup:
Entry: Below 109.68
Targets: 105.24 → 102.71 → 99.50
Stop: Above 117.55
🧠 Strategy Notes:
$AMD is showing early signs of a confirmed Wave 3 advance, which typically brings the strongest directional move. Holding above 115.00–117.55 will be key for maintaining bullish momentum. Momentum confirmation through increasing volume and strong daily closes would further validate the move.