📱 $AAPL (Apple) – Daily Technical Analysis & Trade Plan
Price Stats:
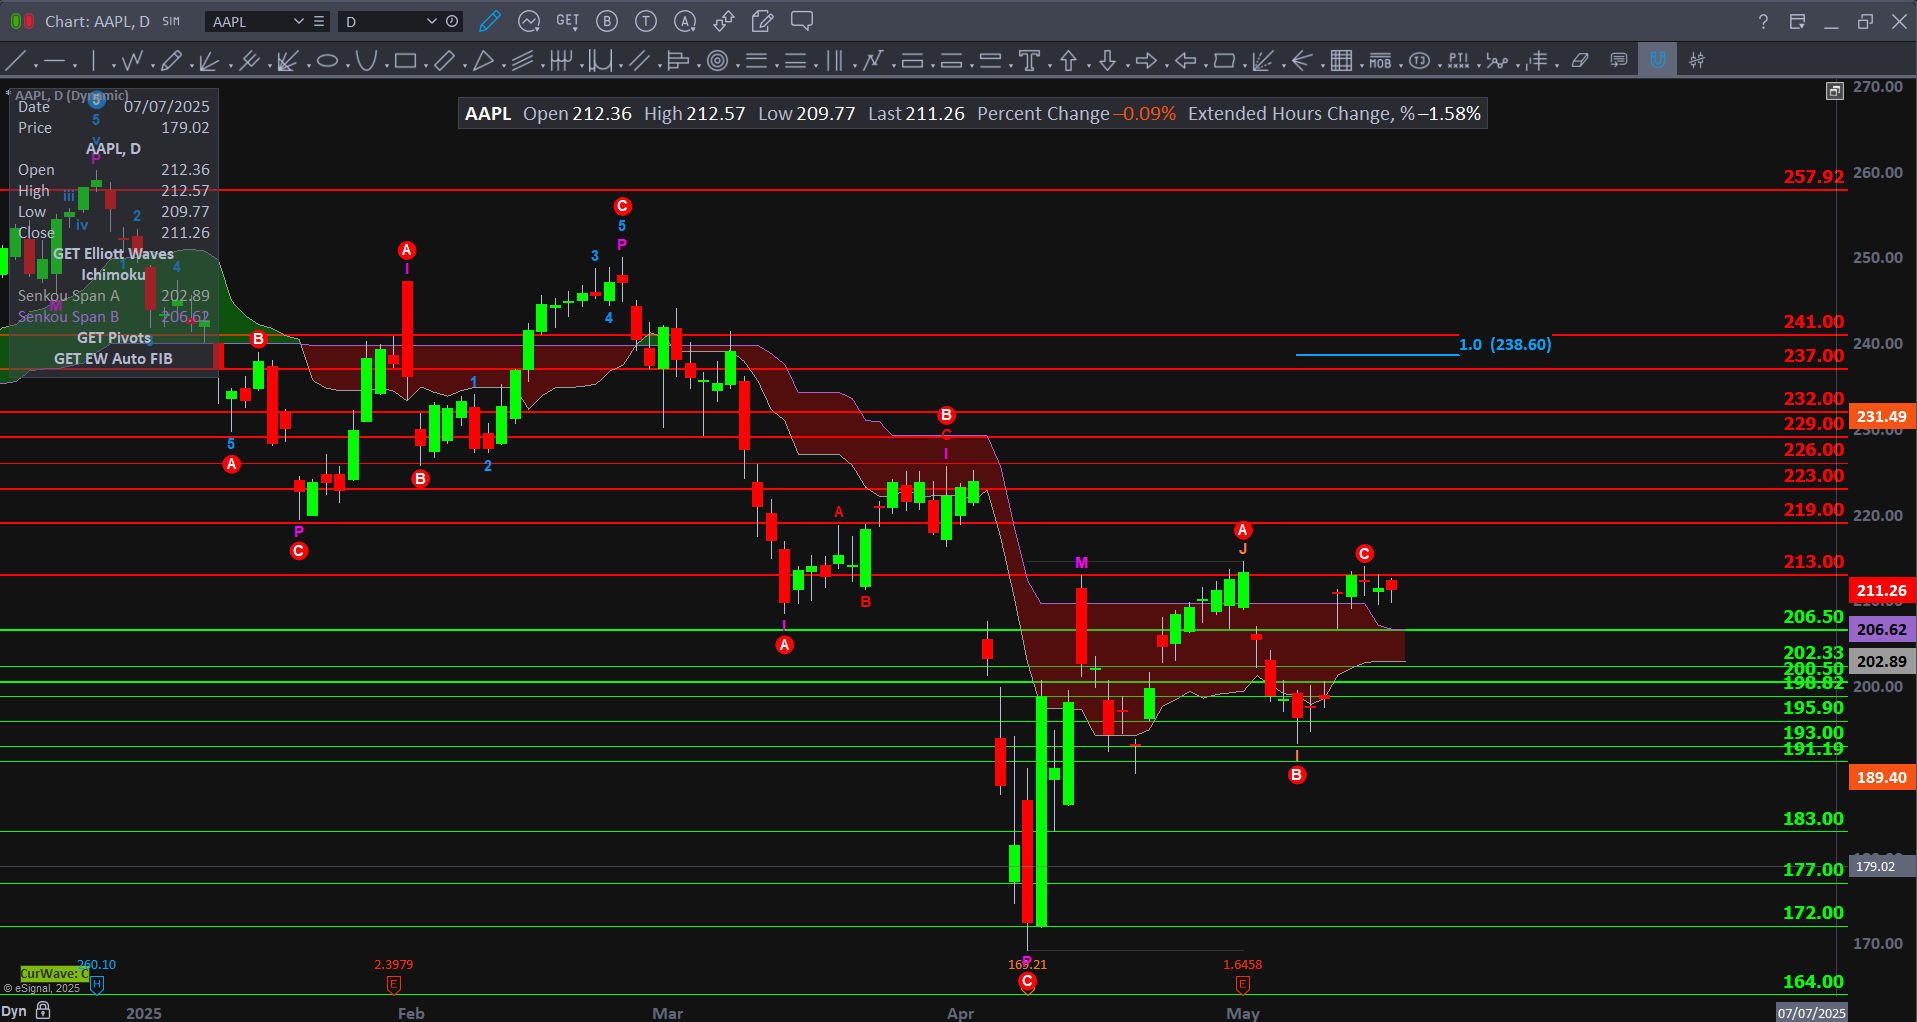
Open: 212.36 | High: 212.57 | Low: 209.77 | Close: 211.26 | Change: -0.09%
🧩 Technical Structure:
Wave Analysis:
$AAPL is consolidating just below a key horizontal resistance at 213.00 after completing a corrective ABC wave structure. Price action remains inside the Ichimoku cloud, indicating indecision but potential for a breakout.
Breakout Confirmation:
A clean close above 213.00 would confirm bullish continuation and target the next wave of Fibonacci resistances. Until then, price is range-bound between 206.50 support and 213.00 resistance.
Fibonacci Target Zone:
The next bullish wave targets the 237.00–238.60 zone, aligning with the 1.0 Fibonacci extension from the previous impulse.
🔁 Updated Key Levels – $AAPL
Resistance Levels:
213.00 | 219.00 | 223.00 | 226.00 | 229.00 | 232.00 | 237.00 | 238.60 (1.0 Fib) | 257.92
Support Levels:
206.50 | 202.33 | 200.50 | 198.82 | 195.90 | 193.00 | 191.19 | 189.40 | 183.00 | 177.00 | 172.00 | 164.00
✅ Bullish Scenario:
Trigger: Breakout and hold above 213.00
Trade Setup:
Entry: Above 213.00
Targets: 219.00 → 229.00 → 237.00
Stop: Below 206.00
⚠️ Bearish Scenario:
Trigger: Breakdown below 206.50
Trade Setup:
Entry: Below 206.50
Targets: 202.33 → 195.90 → 191.19
Stop: Above 213.00
🧠 Strategy Notes:
$AAPL is trading in a narrow range just beneath critical resistance at 213.00. Bulls must reclaim this level to unlock higher Fibonacci targets. However, a breakdown below 206.50 would invalidate near-term bullish momentum and expose lower support zones.